Advanced
Rendering
Deep dive
How to debug random graphics bugs
10 min

Please, bookmark this article. There will be a time when you or someone on your team will face an issue like this. This article can save you days of debugging!
My game flashes randomly. Once every few minutes. For a single frame, some mesh looks stretched to its limits. One frame later, everything is back to normal.
It is not predictable. It happens only on specific hardware, on one GPU architecture.
I reinstalled the drivers and the issue was still there, just harder to reproduce.
QA can reproduce it, but not reliably, because there is no quick repro. Players also report things like "random light flashes".
Whether it is a weird shader path, a driver bug, or an engine bug, even thinking about it gives me a headache. How can I debug it?
Below is an example issue like this:
I faced similar issues a few times in my career. In the worst case, I spent 2 full months debugging a single bug like this. Yes, 2 months of debugging, but it taught me a lot and improved my thinking and debugging process.
Here I will share how I approach these problems and what I learned. It will not fix every bug, but it may save you days of debugging.
In this article:
Why single-frame graphics bugs are so painful to debug.
How I set up reliable reproduction and automated detection.
How I use divide-and-conquer to find the culprit draw call or shader.
How I remove undefined behavior and make shaders compiler-proof.
How I implement in-shader error reporting when debuggers fail.
Real Unity and platform issues I hit in the past.
___
Issue
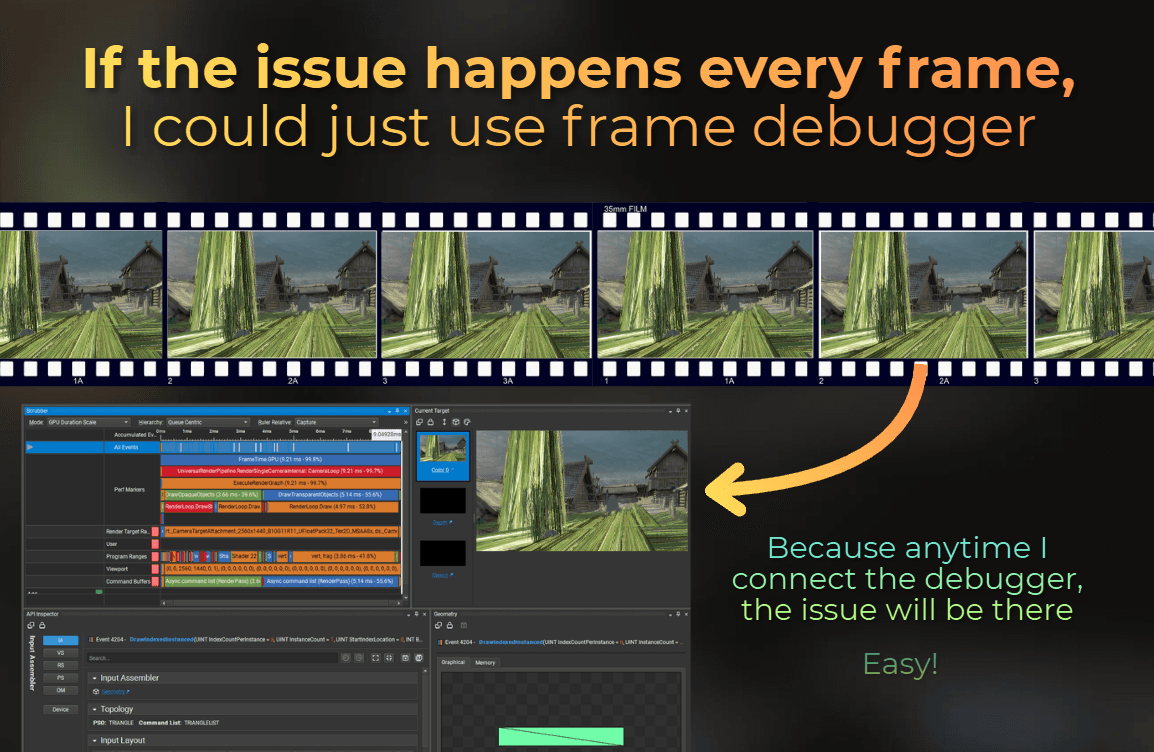
In the best case, the issue happens every frame. I can connect the debugger and walk through the frame events to see what went wrong.
But the world is not ideal. Here, the issue lasts one frame and disappears. If I connect the debugger, the issue stops showing up.
Even if I notice it, by then it is already too late to open the frame debugger.
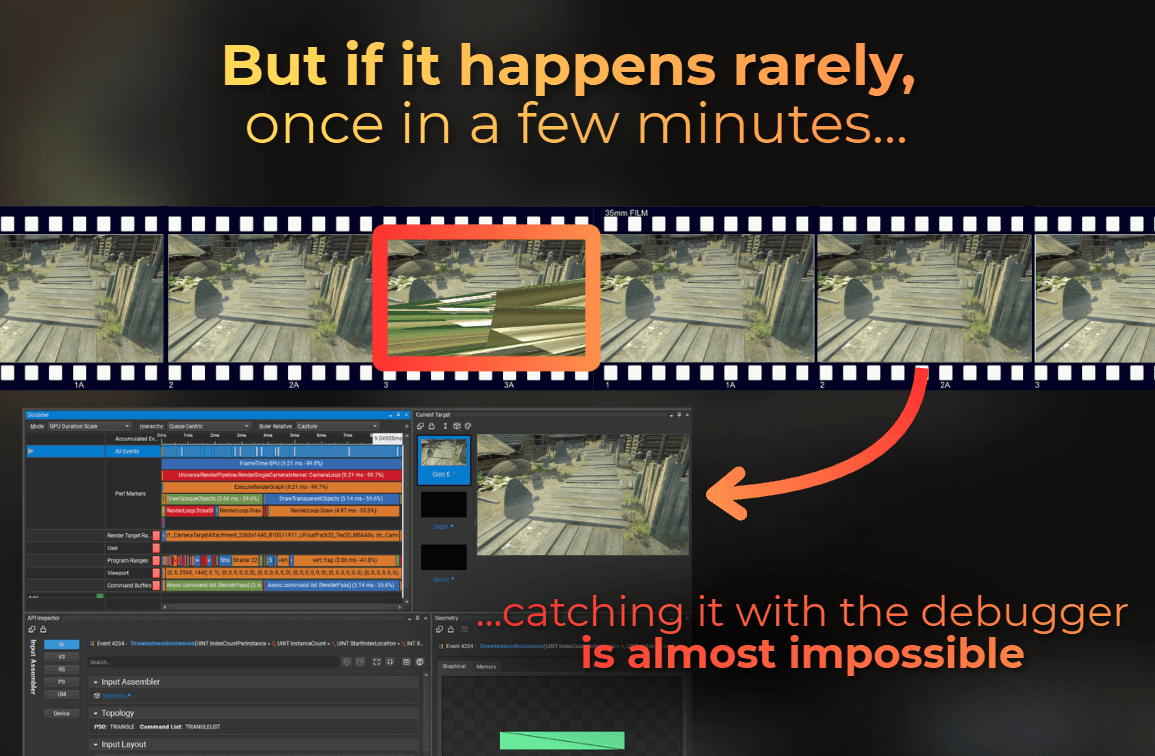
Single-frame issues are non-debuggable "by design". There are no tools to help me. I am on my own, watching bugs flash on screen that I cannot catch. But I figured out a way:
Here are my debugging steps:
___
Step 1. Reliable reproduction
The first thing I need is a way to know whether the bug still exists. That sounds obvious, but with rare single-frame issues it is surprisingly hard to answer.
If the issue is caused by something random, I need deterministic repro steps. And if it shows up for one frame every few minutes, I do not want to rely on my eyes.
I should not use my eyes at all. Look how silly this is: I expect myself to analyze 60 images per second for a problem that happens once every few minutes. That is 3,600 images per minute, and 216,000 per hour.
After 2 hours my brain will start hallucinating the bug because of fatigue. Guaranteed. I've been there 😂

This is how I look after a few days of debugging such issues without the automated repro ^
There is also a different problem. When do I consider the issue fixed?
If the repro is very rare, if it did not happen in the last hour, is it fixed? Or did I just make it less frequent? Hard to tell.
I want deterministic repro steps and automated detection, so I can run the test overnight on a few workstations.
I spend extra time on the repro, because it saves my sanity.
Even one PC running overnight with imperfect detection beats staring at the screen, eye strain, and debugging depression slowly creeping in.
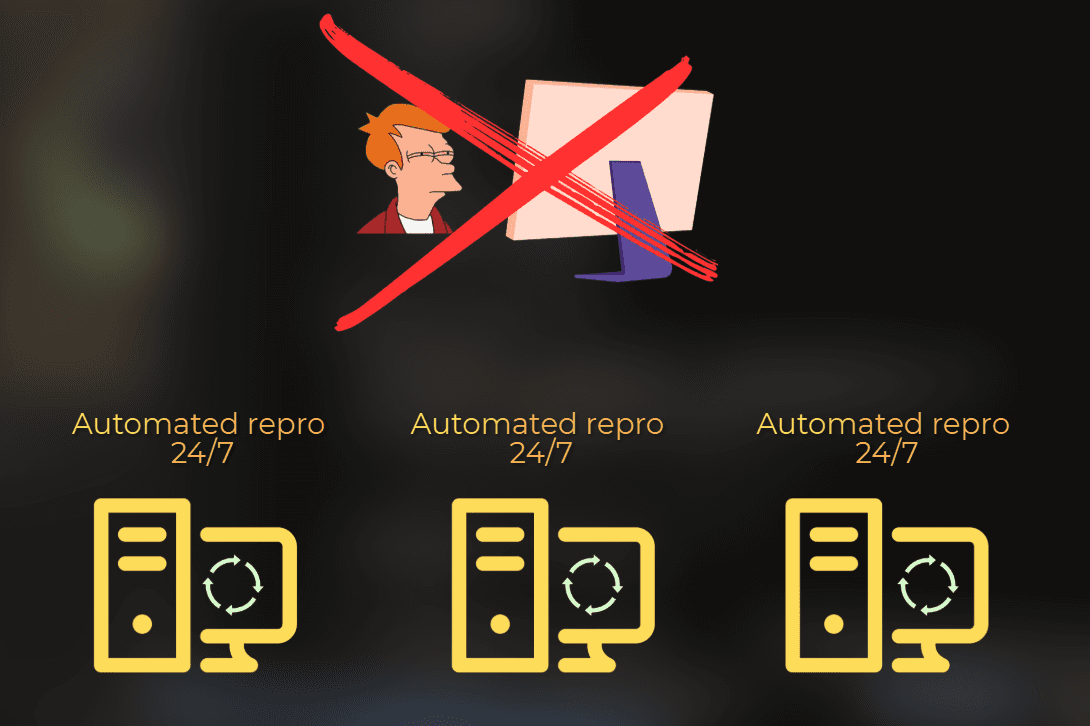
Now, for the test, the two requirements are:
Detect when the issue happens and log it somewhere
Never report false positives. Normal game behavior should never count as a bug.
To build this detection, I look at the image when the bug happens and note what changes. Then I write "virtual eyes" that watch for the same thing. Usually that means a few extra compute shader passes.
As an example, if the issue creates bright flashes, I divide the screen into tiles and use a compute shader to get the average color in each tile. Then I compare values between frames in each area. If the average jumps a lot, the issue is detected. When that happens, I bump a counter and draw a small on-screen indicator. I avoid GPU readbacks because they can affect the pipeline.
I can also save the last 4-10 frames in a ring buffer inside a texture array. When the error happens, I read back those frames and save them to files. Then I can inspect the bad frames plus a few before and after. It is worth checking that this capture path works before you rely on it.
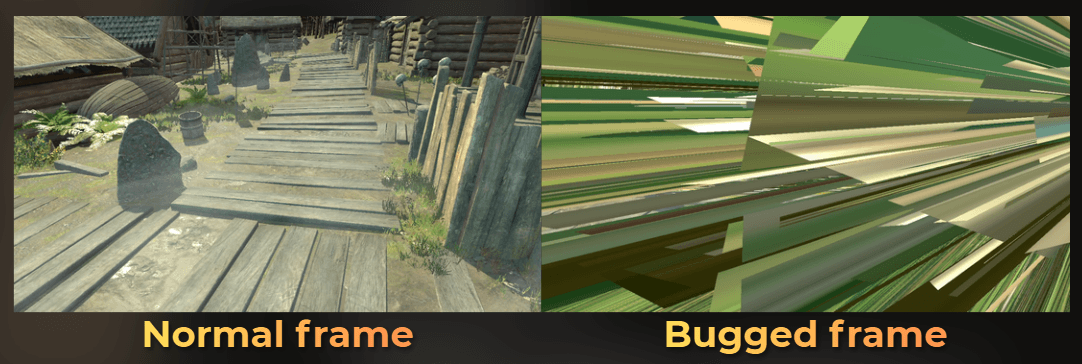
For example here, detection is easy. I calculate the average color using a pyramid buffer and compare it with the previous frame.
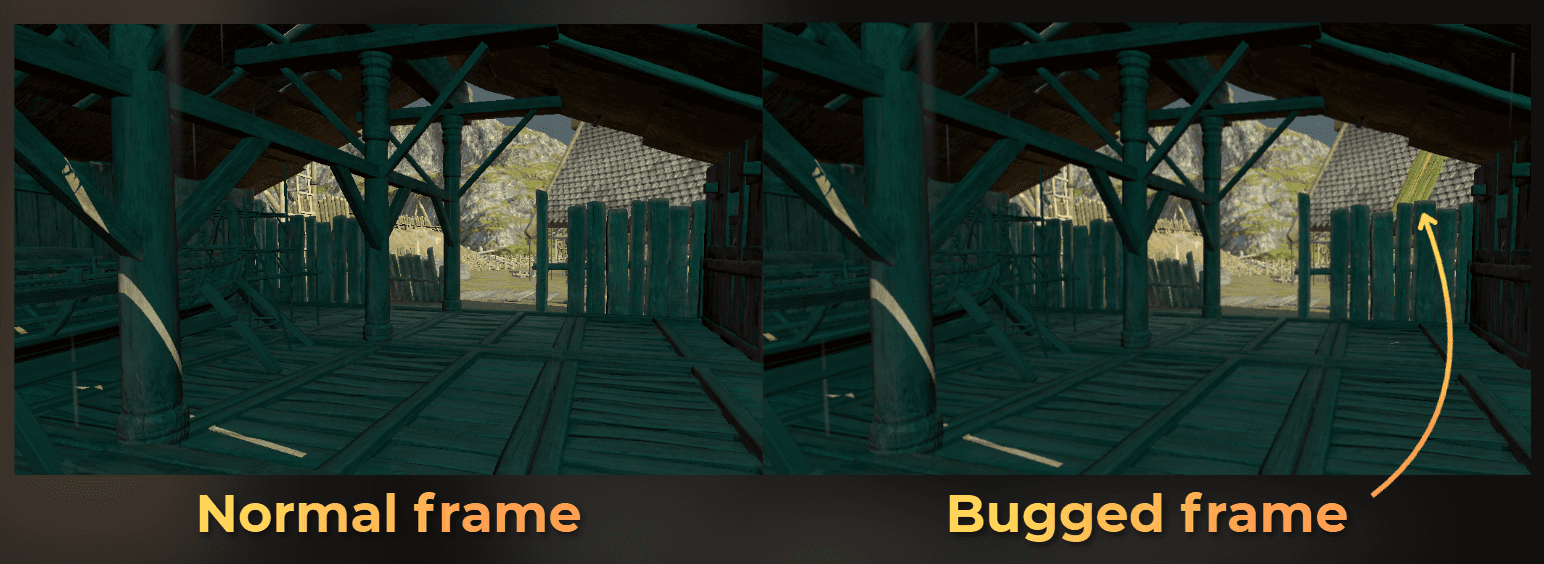
Here, detection is much harder. I probably need to scan average color per screen tile (like 128x128 areas) and detect sudden green changes or normal map changes.
I always thank myself after setting this up. It saves a lot of sanity.
I have one article about deterministic benchmarking that may be useful here:
https://www.proceduralpixels.com/blog/how-to-properly-profile-your-game
Example detection
This is how the example detection works. After the issue appears, it renders a persistent red quad on the screen.
It detects sudden color changes in the final color buffer compared to previous frames.
I save the average screen color into a buffer and compare the current frame with the previous one to guess if something went wrong.
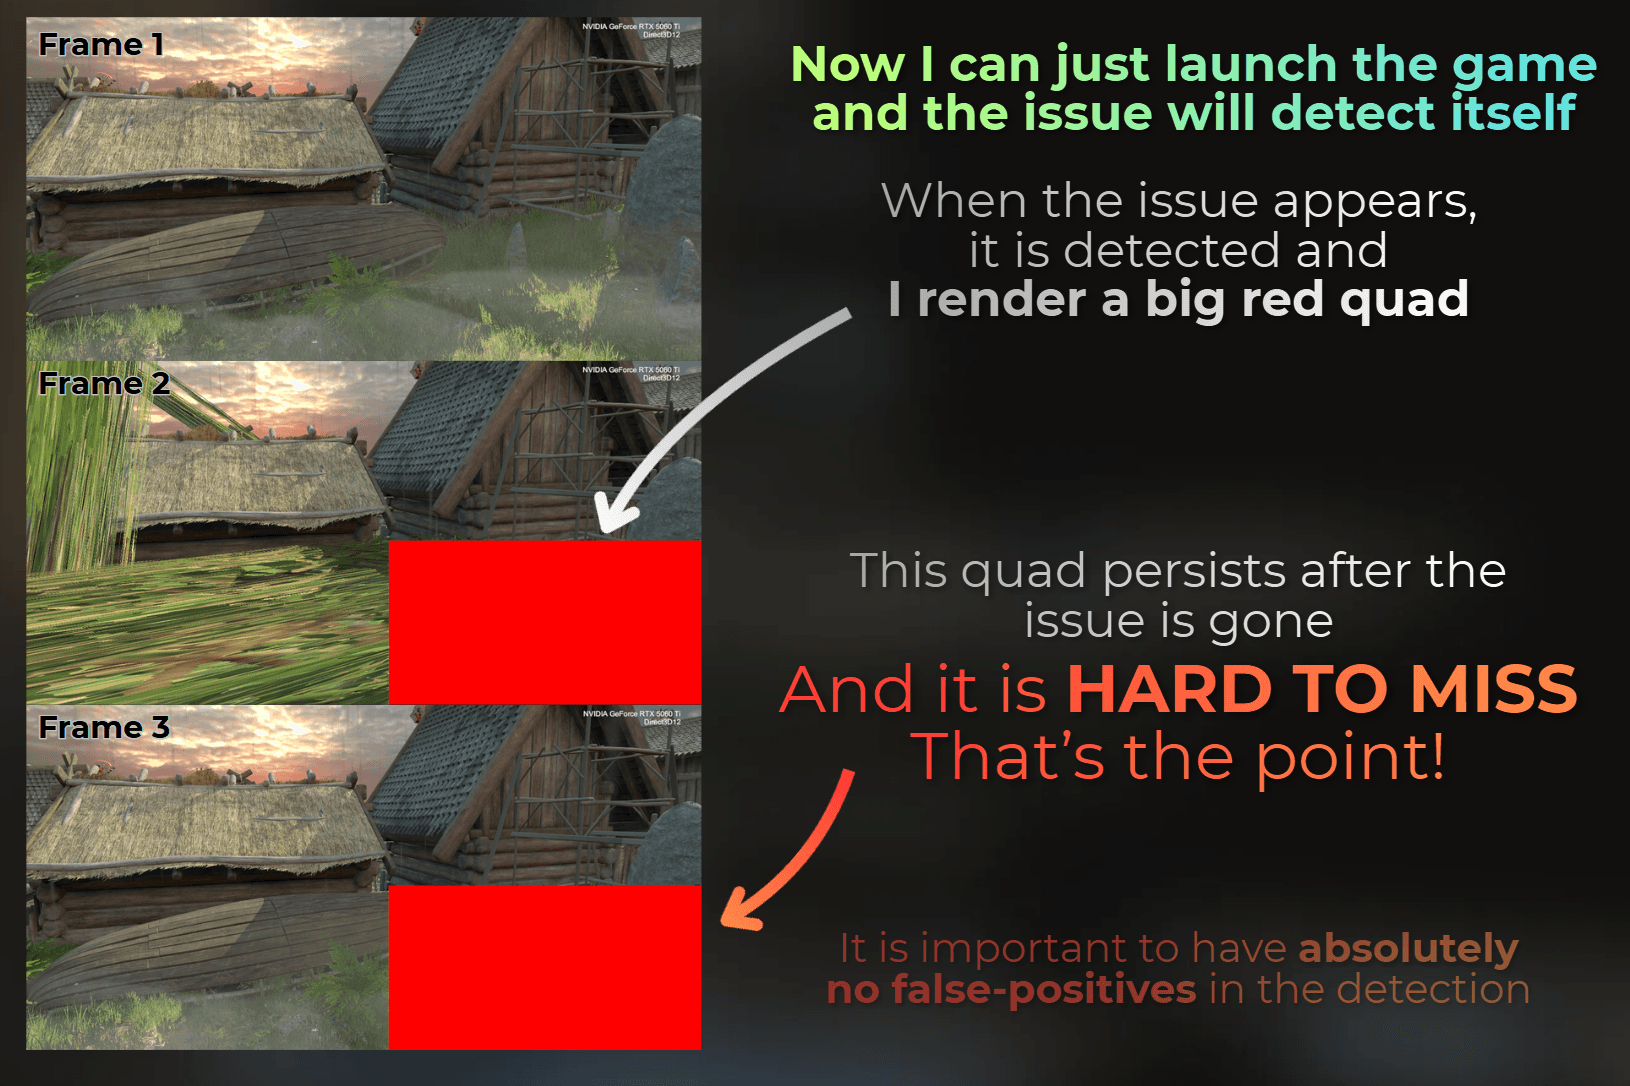
When the camera moves, detection is disabled to avoid false positives.
I tune the threshold manually by watching a few captures and adjusting sensitivity until false positives go away.
After the issue appears, this data stays in a buffer and the draw call uses it to conditionally render the red quad.
In the video you can see the red quad after the issue appeared. I recorded at 30 FPS for my website, and unfortunately the actual bugged frame got skipped. But there is one bugged frame recorded after detection. That big red quad is hard to miss. That is the point.
___
Step 2. Divide and conquer
Now, if I can reproduce and detect the issue with my virtual eyes, I disable groups of rendering objects to get closer to the cause. My goal is to find the exact shader or draw call that creates the issue.
Divide and conquer is the best way to catch bugs like this. If you have an algorithmic background, you know the drill. Disable half of the project and see if the issue persists. If it does, disable half of what is left.
If this sounds like overkill, remember that each step rules out half of the suspects. For one million objects, you need just 20 iterations to find the one! But that is theory. In practice you will do more 😂
Custom debug tools help a lot here. They are easy to make with AI.
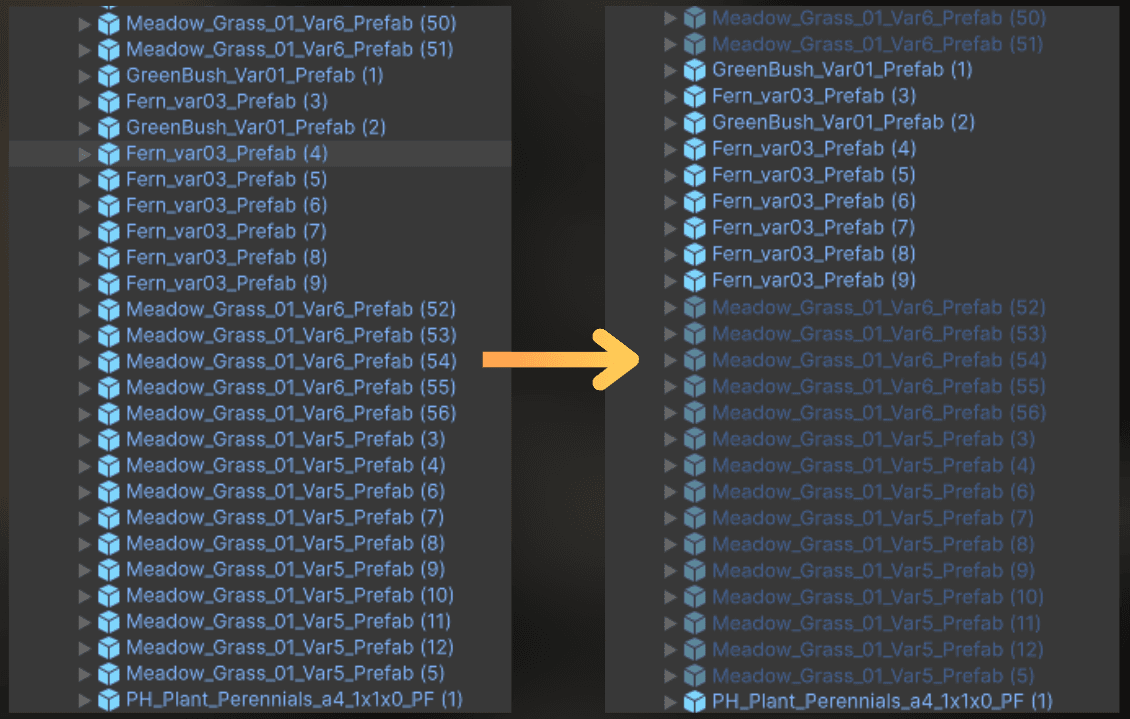
Here, I disabled all prefabs with "grass" in their name. If the issue still appears at the same rate, grass is probably not the cause. If the repro rate drops a lot, something is sus with the grass. If the issue goes away, the grass objects are the cause.
I like a tool that lets me disable objects by name match. For example, disable all MeshRenderers on GameObjects with "grass" in the name, with an option to undo.
My goal is a runtime tool where I can:
Disable all objects with a particular shader
Disable all objects with a particular material
Disable all shadows
Disable all lights
Disable all individual render passes
Disable objects with specific meshes
Disable particle systems, decals, VFX graphs, postprocess, UI elements, skinned meshes...
That's the idea
Below is an example runtime tool that lets me disable specific components or objects with undo/redo.
With AI it takes a few minutes to get a tool like this for your project. Here is the prompt I used. I used Composer Fast model from Cursor:
https://gitlab.com/-/snippets/6041379
With automatic detection, life gets easier. I switch some objects off and wait for the repro. Sometimes I run this overnight to make sure I did not just reduce the frequency.
But I need to be careful. Disabling objects often does not kill the bug completely, it just makes it less likely. Overnight tests matter. Rendering is complex too, and disabling things can change how whole systems behave. So I do not jump to conclusions. I usually test 2-3 different theories before I trust one.
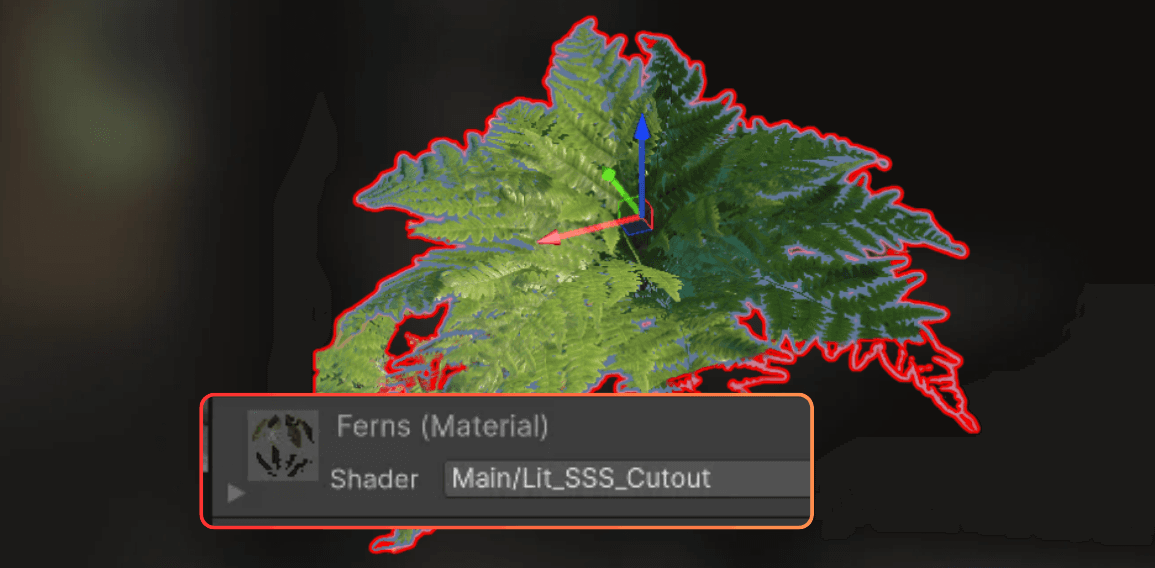
At the end I usually know which shader is the main culprit.
___
Step 3. Divide and conquer on a single object/shader
Now I know which shader causes the issue. Time to debug it. But... how?
It is good to check the object setup first:
Play with renderer settings
Modify color blending
Modify depth testing mode
If you didn't find the root cause of the issue yet, it is time to jump into the shader.
Same idea as before - divide and conquer, but inside one renderer and its shader code.
You can do this by removing individual shader features, and then focusing on undefined behaviors.
Many shader values need to stay in a valid range: 0-1 for colors or masks, -1 to 1 for normals, vectors normalized, and so on.
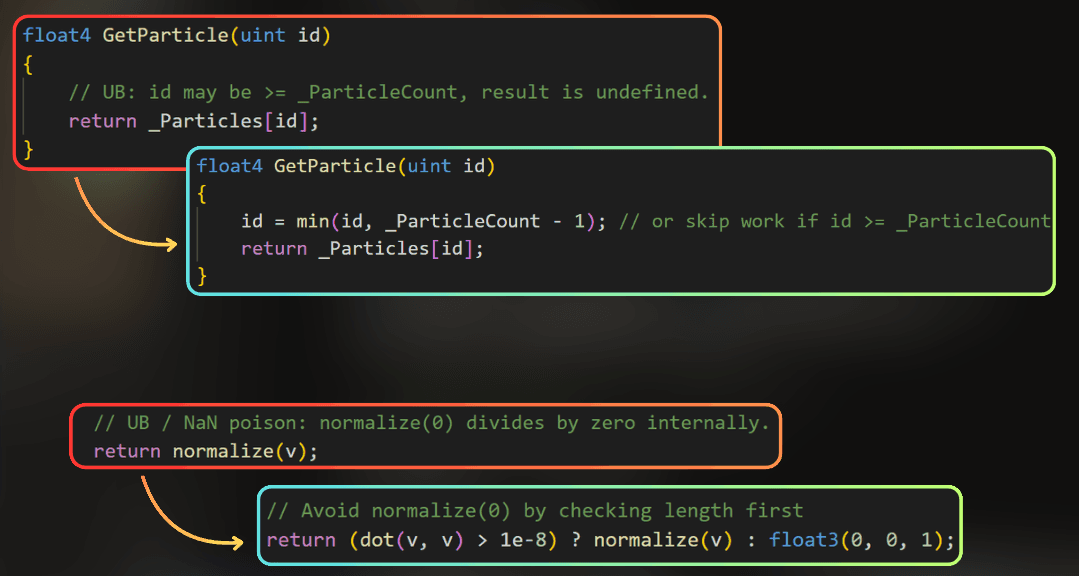
Some edge cases cause weird behavior: dividing by zero, normalizing a zero vector, or taking a fractional power of a negative number.
Some operations return NaN (not a number). I add guards for those too.
It is worth adding safety checks in the shader. Like max(0.0001, x) before dividing. Or clamp(x, 0.0, 1.0) for interpolation.
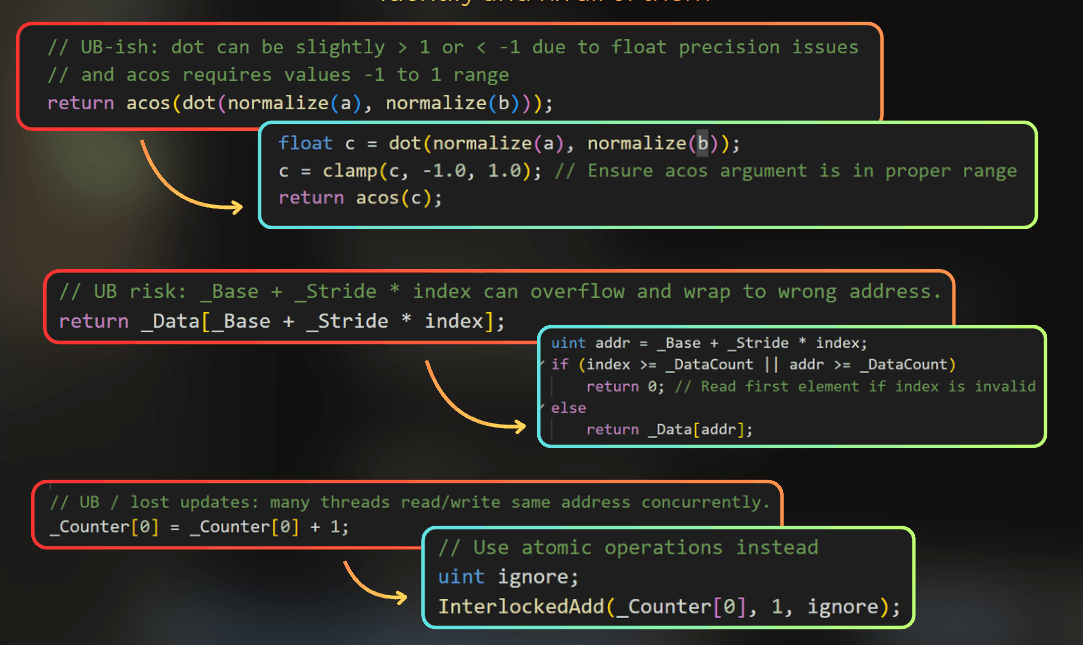
I also watch out for shader keywords that trigger weird compiler macros.
The goal is to remove shader logic flaws that could cause the issue. From my experience, many bugs come from undefined behavior.
Now, the absurd part. Many compilers optimize aggressively for the target device. That is when weird things can happen, to the point where I cannot trust basic computer science anymore. So I also make my code compiler-proof. Here is what I mean:
The worst case I remember - uint compiled as a float
I remember one nasty issue. A larger codebase used an HLSL library for masks, object IDs, and similar data. It ran in compute shaders and fragment shaders.
The masks were stored as uint. Imagine code like this:
On one device, this code never entered the if block. We checked the logic many times. It was simple and worked everywhere else.
Then we tried this version:
And the code started to work properly.
Look how absurd this is. The lowest value a uint can store is 0. The next one is 1. So mask <= 0.1 should give the same result as mask == 0u.
For some reason, the compiler on that device probably treated mask like a float with a small epsilon.
We kept the mask <= 0.1f version. But God forbid a programmer reads this later and "fixes" it back to mask == 0u.
___
Step 4. In-shader error reporting
If removing undefined behavior did not help, it is time for shader debugging. Debuggers will not help here because the issue is random. So it is time for our lovely and professional Debug.Log("Shit") debugging.
My goal is to print error messages from a single shader run, somehow.
There is no way to print from a shader into the game console, right? ...

WRONG! I just need to build this logging myself.
Two options:
UAV - add an unordered access view, like an append buffer, and append error messages there.
Additional render target - write error codes into pixels, encoded as colors.
When an error happens, I need a way to show it on screen, save it to a file, or print it in the console. The errors should stay visible after the bad frame. A few ways to do that:
Any compute shader that copies errors into a persistent buffer works, because I can inspect it in a graphics debugger.
Read errors back to the CPU and log them in the game console or log files.
Use the error data for indirect draws to visualize errors on screen.
In-shader error reporting is tricky because the shader is already broken, so the reporting path might fail too. But it is still worth trying.
Below I show how to build a small library for logging from shader code.
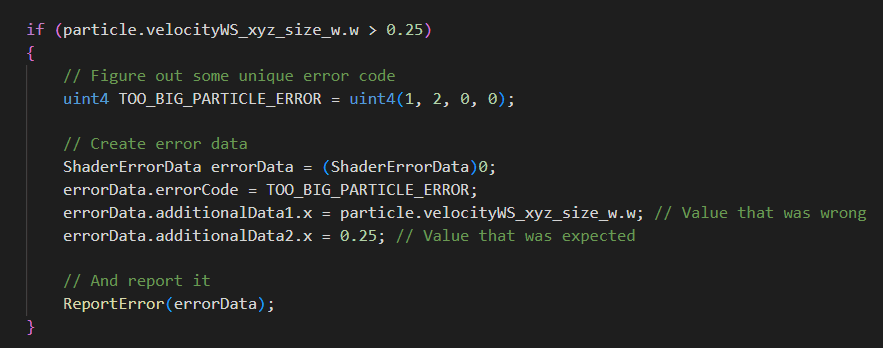
The idea is to report issues from the shader like this:
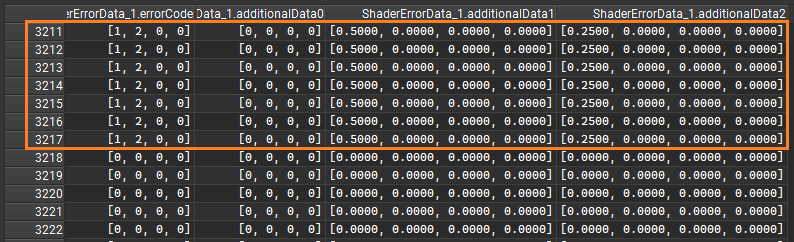
And read the messages using the GPU debugger:
Reporting through append buffer
Here is how I implement error reporting through an append buffer (UAV). GPU buffers let me build a thread-safe list of error messages. I do it in a few steps:
Prepare a data layout for error messages.
Create and bind the error buffer
Report errors from the compute shader.
Inspect the error buffer in the graphics debugger.
Then I can extend that to read errors back on the CPU and log them, or render them in a draw call.
I will show a simulated bug where the particle simulation creates a particle that is too big. It is not a real scenario, but it shows how to set up the tool.
1. Prepare data layout for error messages
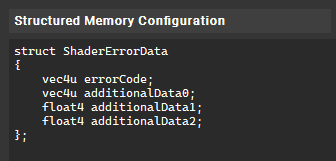
I created matching structs in C# and HLSL. Each message has an error code and some extra data.
2. Create and bind the error buffer
Somewhere in the code, I create a buffer to store those errors. The class below initializes the graphics buffer with cleared memory at Unity startup.
To report errors from a compute shader, I bind the error-reporting resources first. Here is an example with a particle system, assuming the compute shader already supports reporting.
3. Report the errors from the compute shader
Now I create the HLSL library to report errors. It is simple. InShaderErrorReporting.hlsl
Then I use it in the compute shader. First, include the reporting library:
Then in the shader code I report an error if the particle size is too big. This is a fragment from the particle simulation shader.
So when this library is in place, I add it to the shader and call ReportError. Easy.
The downside is that it adds 2 UAVs to the shader. For shaders already near the UAV limit, I need to reuse existing buffers instead. But it is always possible somehow.
Also, adding error reporting changes the faulty shader. That can change how often the bug reproduces, same as any debug tool. Worth keeping in mind.
4. Inspect the errors through the graphics debugger
Now I use Nvidia Nsight Frame Debugger to inspect the reported errors. I wrote more about connecting Nsight to Unity here: Using native GPU profiler with Unity Editor
I found the indirect compute dispatch that can write errors and has ErrorBuffer bound to it.
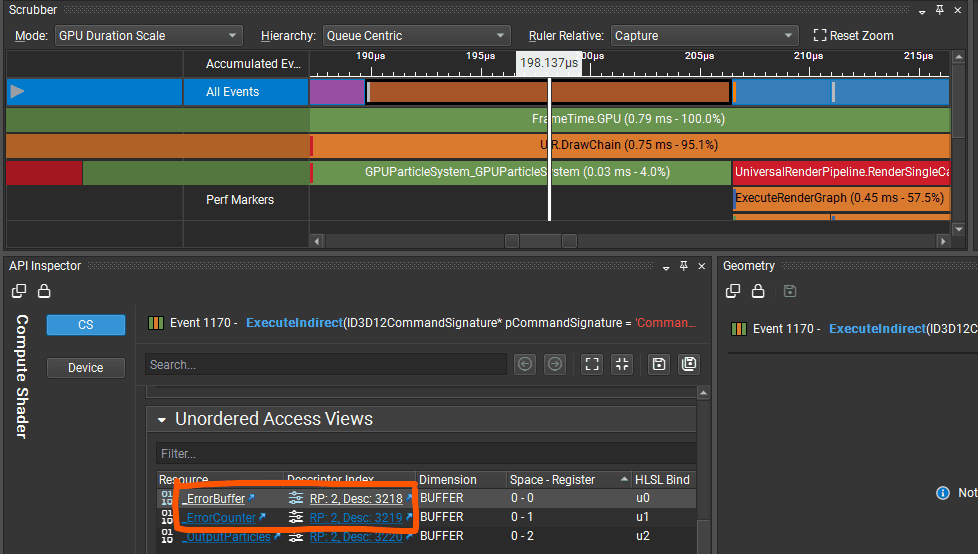
Here I can inspect the buffer data and search for errors.
The game ran for a short time. This is _ErrorCounter, with 3218 errors reported.
:center-px:
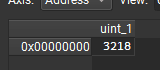
In _ErrorBuffer I can inspect the reported errors. I set the data layout:
:center-px:
And here are the reported errors:
The last error is at index 3217. This is basically Debug.Log("") inside shaders.
With the error list, I do not have to stop here. I can read the errors back, decode them, and print them in the game console or a log file. Or add draw calls that visualize the error values on screen.
Reporting through an additional render target
When I cannot add UAVs to a fragment shader, I use a second option: an extra render target.
For forward rendering, instead of only a color target, I add a "debug color" target. By default I write zeroes to it. When shader execution fails an assertion, I output error codes as colors.
Then I add a compute shader that checks whether all values in the texture are zero and collects errors into a smaller buffer. Same idea as UAV reporting, but errors go into a texture instead of a buffer.
___
Step 5. Fix the issue and report it if needed
With those tools I can usually find the issue. The next question is what kind of bug it is:
Driver/engine bug? Then I need a workaround with a different approach, and I report the repro to the GPU vendor, engine vendor, etc.
Shader/CPU code? Great. I just patch it.
Remember to report bugs like this when you can. Save other developers from post-debugging depression!
___
Issues I faced with Unity
Not every random graphics bug comes from my shader logic. Sometimes the engine, driver, or platform is the problem, and my job is to find a workaround or a minimal repro to report upstream.
Here are three real categories of issues I hit in Unity projects.
Constant buffers with garbage memory
:center-50:
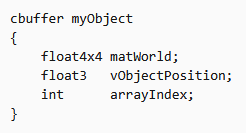
I found that constant buffers in Unity sometimes pointed to garbage memory instead of the correct data. One frame every few minutes had bad constant buffer data.
It happened once for all objects in the transparent queue. I had to rewrite all transparent shaders to read data from somewhere else. Luckily there were only a few in that project.
Whenever a shader in the transparent queue used the CBUFFER_START macro, it could create those glitches.
In another project I saw the same thing with compute shaders. One constant buffer sometimes pointed to garbage instead of valid data. I replaced constant buffers with structured buffers and the issue went away.
I caught these only after I added in-shader error reporting with assertions on constant buffer values.
Texture clear and initialization issues
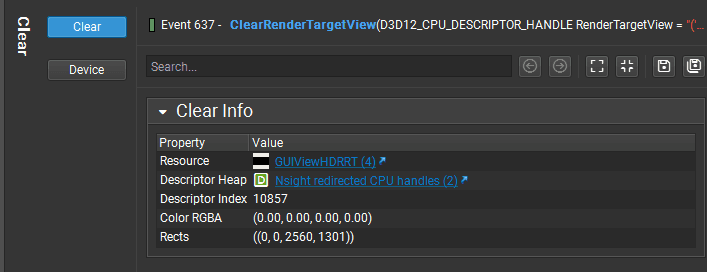
On one iOS device in one project, buffer clearing sometimes led to rare GPU crashes or corrupted render targets. That showed up as tile-like artifacts on screen.
I disabled Unity camera clear events and replaced them with a full-screen shader that cleared the buffer in software.
Hardware clears became shader-based clears, and that fixed it.
Varying depth-test types within a single rendering queue in Unity
On some devices I got nasty tile-like artifacts that looked like corrupted VRAM. 16x16 or 32x32 pixel blocks would get random colors, or go fully black or white for a while.
:center-50:

It happened when I mixed depth tests in one queue. For example, one renderer with LEqual and another with GEqual right after it. On some devices that corrupted depth buffer data.
The fix was to split the work into separate passes: first all LEqual objects, then all GEqual objects.
Again, this showed up in one project on one very specific device.
___
Summary
Random single-frame graphics bugs are painful because debuggers basically do not exist for them. My workflow is: build reliable automated repro, then slowly dig through the problem using divide-and-conquer strategy.
My usual order:
Build automated repro and detection, then run it overnight on multiple PCs or consoles if possible. I only do this when the bug is hard to spot and reproduces rarely.
Use divide-and-conquer tools to isolate the shader, material, or object group.
Remove undefined behavior and add compiler-proof checks in the suspect shader.
Add in-shader error reporting when I still cannot see the bad values.
Decide whether to report a minimal repro upstream or rewrite the broken rendering path.
At the end there are usually two routes:
Create a minimal repro and report it to Unity, Nvidia, Microsoft, or whoever owns the platform. They probably will not fix it quickly, but it is still worth reporting.
Redo that part of the game without touching the thing that triggers the bug.
For rare bugs, I usually budget 1-2 weeks. My worst case was 2 full months on one bug like this.
I hope this article saves you some time. But I really hope you never need it.
And if you are fighting such a bug right now, I hope this article feels like a legendary sword for the fight. Good luck!
And please, bookmark this article. There will be a time when you or someone on your team will face an issue like this. This article can save days of debugging!
___
You may also like
The art of debugging the rendering