Beginner
Optimization
Tutorial
Tech-Art
How to profile the rendering - GPU profiling basics
20 minutes

I show how to install Nvidia Nsight Graphics, connect it to a game build, and use it to identify performance bottlenecks.
Problem with GPU profiling tools
If you're a game developer, you probably opened a profiler and used it at some point. I use the profiler regularly. Profilers help me identify performance issues during development, and I can use that data to optimize my code early.
Unity has a built-in CPU profiler that allows you to see how much the CPU spends on a specific task. This is an excellent tool for optimizing the CPU workload. What about the GPU?
Unfortunately, there is no alternative in Unity for GPU profiling, except for examining the draw call count and framerate. Unity has a Frame Debugger, but it doesn't provide any data about GPU timings.
:center-px:
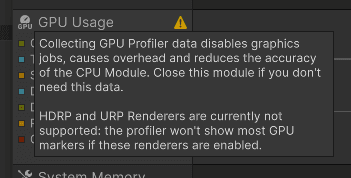
:image-description:
This is what happens when I try to profile the GPU using Unity's built-in profiler.
Native GPU profilers
However, there are some native GPU profilers we can use to profile the GPU. Those are the standalone programs provided by the GPU vendors that can display detailed information about each task executed by your GPU during the rendering.
GPU profilers provide information like:
Time it took for each draw call to complete.
How much did it take to set up the draw call resources?
Throughput of hardware units on the GPU.
Cache hit rate.
etc.
GPU profilers that can provide such information:
NVidia Nsight Graphics - for NVidia GPUs
AMD Radeon GPU Profiler - for AMD GPUs
Intel GPA - for Intel GPUs
PIX - for Windows and DirectX
:center-100:
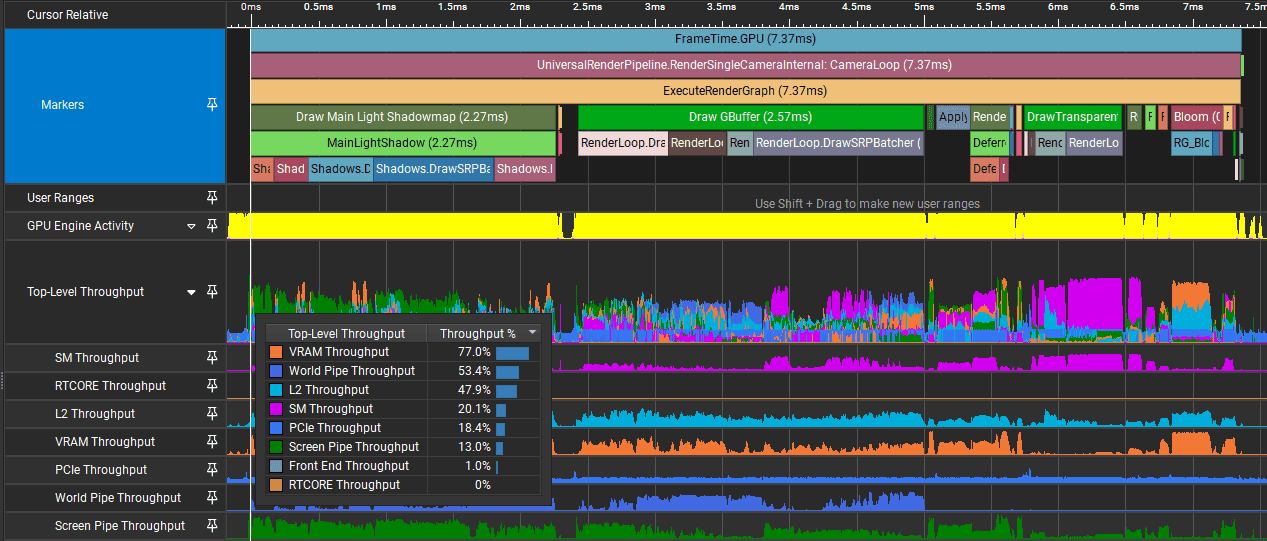
:image-description:
Data from Nsight Graphics GPU Profiler. I can see the exact timings for each draw call and also throughputs of various GPU units.
Profiler != Debugger
It is important to note that a profiler is not the same thing as a debugger. Profiler is a tool that allows you to spot performance issues. Debuggers help you to see what doesn't work correctly. The profiler should provide some granular execution timings to support data-driven optimization decisions.
You probably heard about Unity's Frame Debugger or RenderDoc. Those are the tools that allow you to view the resources, inputs, and outputs of draw calls for debugging purposes. However, these programs don't provide information about GPU timings, but are useful for debugging.
When rendering is correct but has performance issues, use profilers like Nvidia Nsight Graphics: GPU Trace Profiler, AMD Radeon GPU Profiler, or Intel GPA, PIX, depending on the GPU I work with.
:center-50:
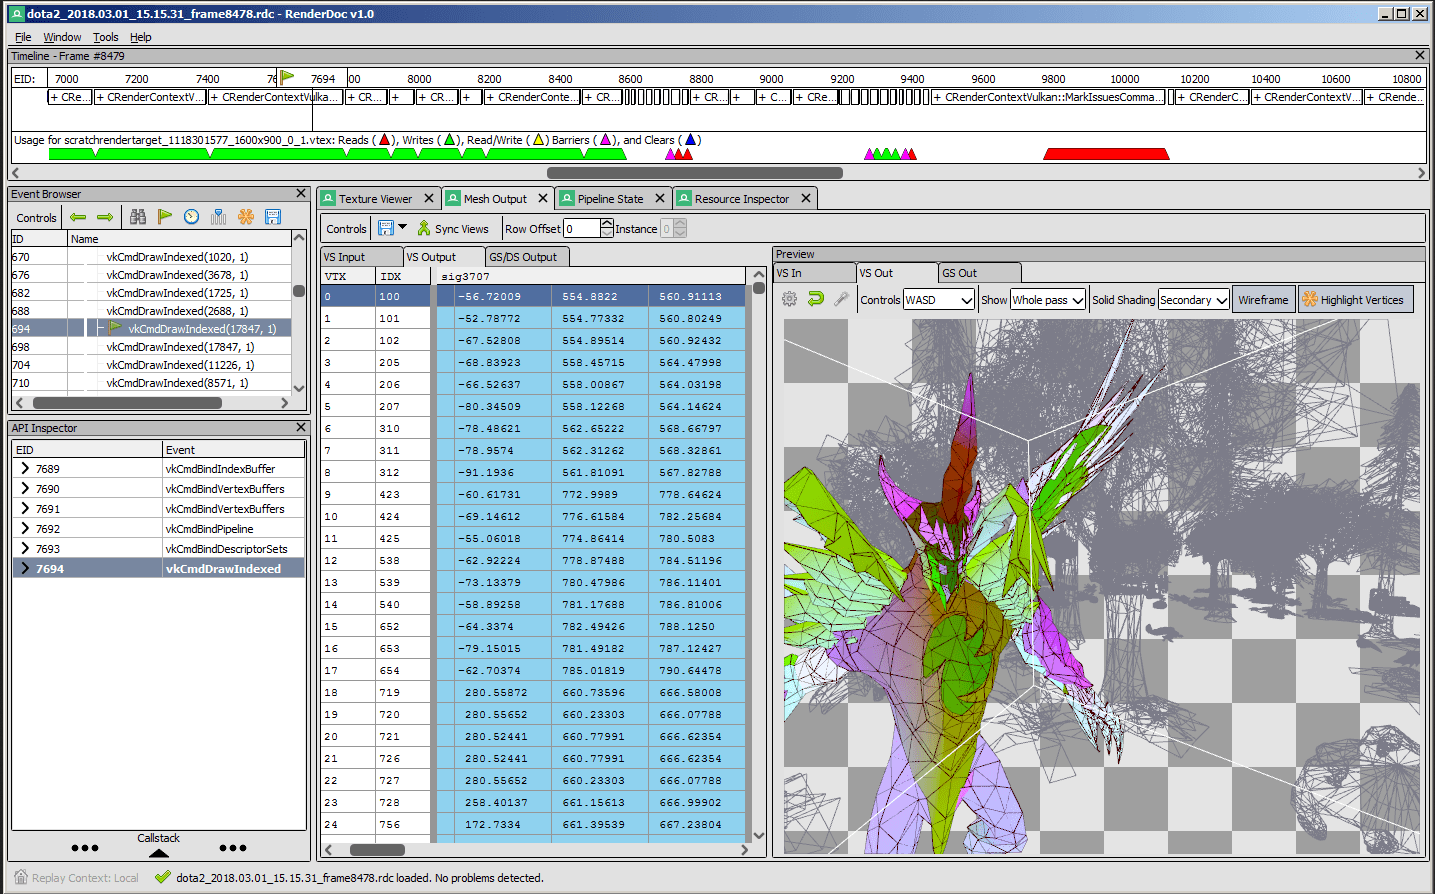
:image-description:
Render Doc provides no performance metrics. It is super helpful when debugging, but it lacks many essential features for optimization (although experienced graphics programmers can make many educated guesses based on the data provided by the debugger). Source: https://renderdoc.org/
___
How GPU profilers work
GPU profilers are a standalone programs that inject between your game and the GPU driver. They monitor the graphics API commands invoked by your game and analyze how the GPU works when executing those commands. They have access to the detailed performance counters of your GPU. As a result, you can see the timings and throughputs of various units for each draw call.
They usually capture one or a few frames from your game and provide the performance metrics only for those. Then you can analyze the metrics and use those to plan the optimizations.
:center-px:
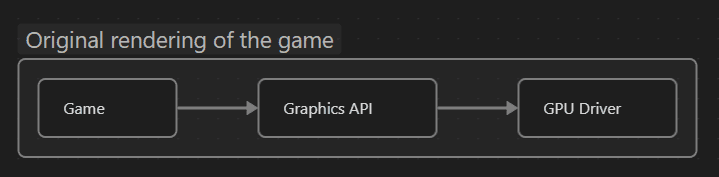
:image-description:
How the original rendering of the game works.
:center-px:
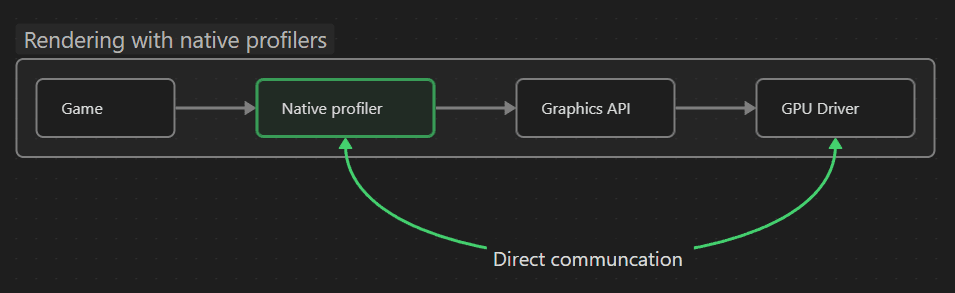
:image-description:
How rendering works when a native profiler is connected.
___
Preparing the build
To profile the performance of a specific feature, I like to prepare the build that renders a camera focused on the feature. In this case, I prepared a scene with a raymarched volumetric fog I created for another (future) article. I created a build that renders this scene. My goal is to profile the performance of the fog trails on the ground. I will show you how I do that.
:center-px:
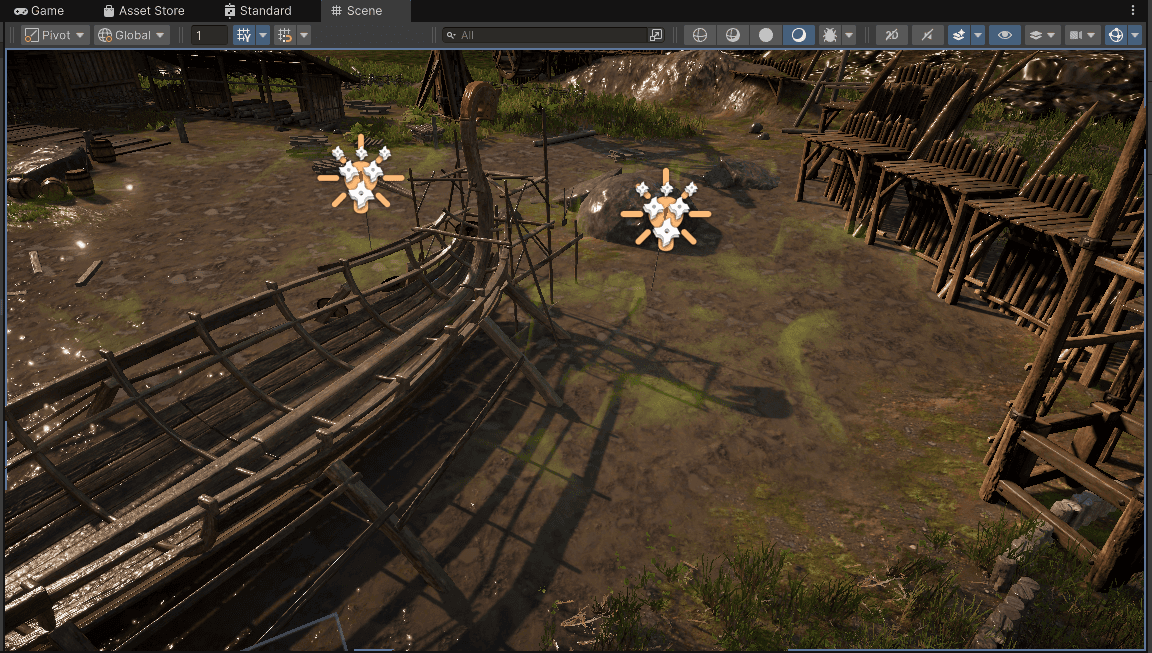
Through this article, I will figure out what the bottleneck of this fog is and what is required to make it faster on RTX 3060. As an experiment, you can guess the issue and see later if you were correct.
___
How to use Nvidia Nsight Graphics
Because I mostly use NVidia GPUs during my work, my go-to tool for profiling is Nvidia Nsight Graphics. In this section, I will explain how to use it. I will use Nvidia Graphics with the build of my project.
My setup:
RTX 3060
Windows 10 (the steps are the same for Windows 11)
Build a Unity project that uses DX12
Here is what I will explain:
Installation
How to launch the profiler
How to connect to the build
Interpreting the Frame Debugger
Interpreting the GPU Trace Profiler
___
1. Installation
I search the installers for the native GPU debuggers on the vendor's websites.
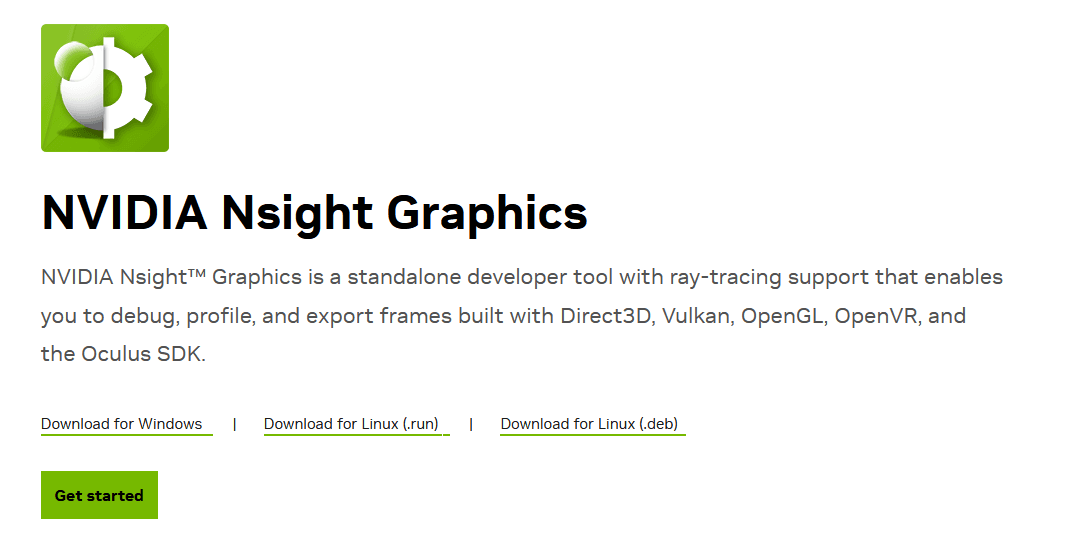
Here you can find the Nvidia Graphics website:
https://developer.nvidia.com/nsight-graphics
:center-px:
I keep two versions installed:
- Newest one (2025.3 as of writing this article) - to profile on RTX series. It works only with DX12/Vulcan.
- 2022.7.0 - to profile on GTX series - it works better with DX11. It is the last version with the Range Profiler feature, which was super helpful to profile a specific range of draw calls in the Frame Debugger.
You can find installers for all versions here:
https://developer.nvidia.com/nsight-graphics-history
___
2. How to launch the profiler
GPU profilers often require administrator privileges to access GPU performance counters through the driver, so it is essential to launch the profiler with those privileges.
:center-px:

:image-description:
Run the Nsight Graphics as an administrator to be able to use all the features.
___
3. How to connect to the build
To start profiling after opening Nvidia Nsight Graphics, you need to start one of the available activities.
:center-px:
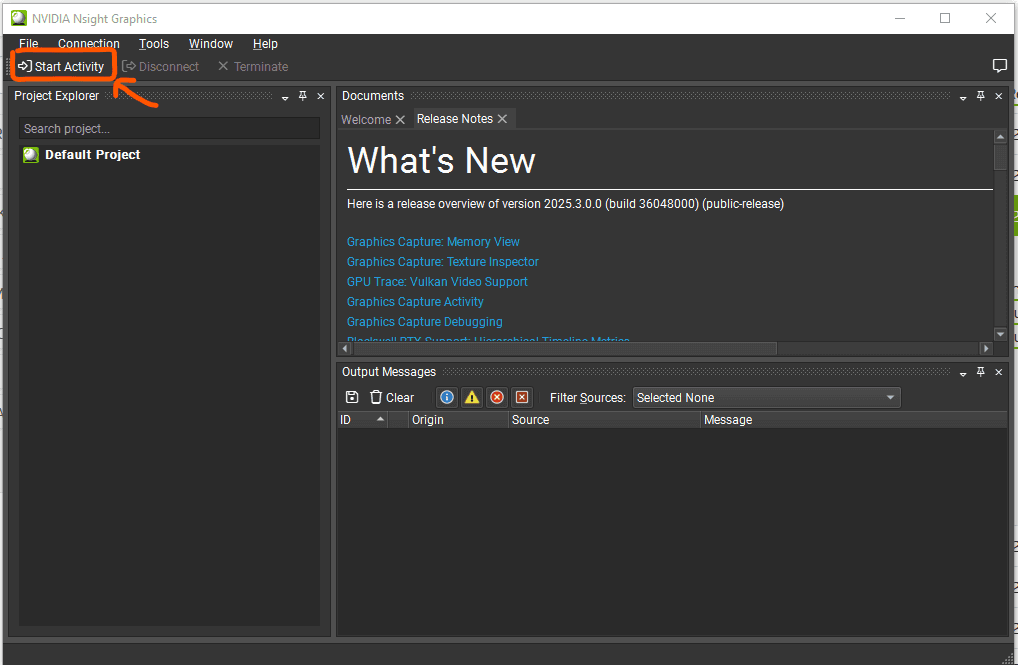
The most important activities are:
Graphics Capture - capture and save the frames from your game. Frame captures work as a standalone program that renders the same frame over and over again, so you can later launch and analyze them with GPU Trace Profiler or Frame Debugger.
Frame Debugger - Allows for the analysis of the rendering of a frame from start to end. Use this if you want to analyze all resources, bindings, rendering logic, and so on. Although it is a Debugger, it displays the timings of each task, making it useful for basic profiling. Older Nsight versions (2022.7) have the profiler integrated into the Frame Debugger.
GPU Trace Profiler - Gives all performance metrics for the analyzed frame.
:center-px:

I recommend using Graphics Capture to capture a few frames and then analyze those frames using Frame Debugger and GPU Trace Profiler. Frame captures work as a standalone program that renders the same frame repeatedly, allowing you to connect other tooling to it.
In older Nsight versions (2022.7.0), use just Frame Debugger it has an integrated profiler feature called Range Profiler.
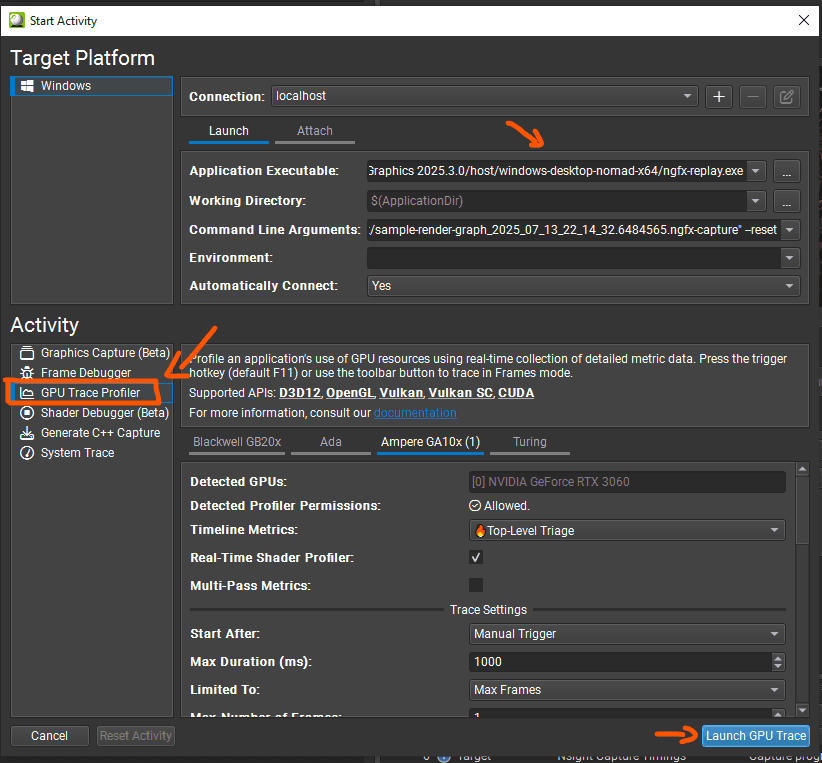
To profile my build, I provided the path to the executable, selected the Graphics Capture activity, and clicked the Launch button to launch the app.
:center-px:

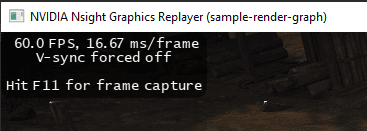
After launching the app, a Nsight Graphics widget was visible in the corner of the screen.
:center-px:

:image-description:
Properly attached Nsight Graphics displays a widget on top of the game.
To capture the frame for analysis, I used the F11 button on my keyboard.
When the frame capture was completed, I saw it in the Nvidia Nsight Graphics window. The frame was saved into a file on my disk. I can go back to analyze this frame at any time. I highly recommend renaming the captured frames for future reference.
I can use this captured frame to run Frame Debugger or GPU Trace Profiler. I will select other activity from the available options.
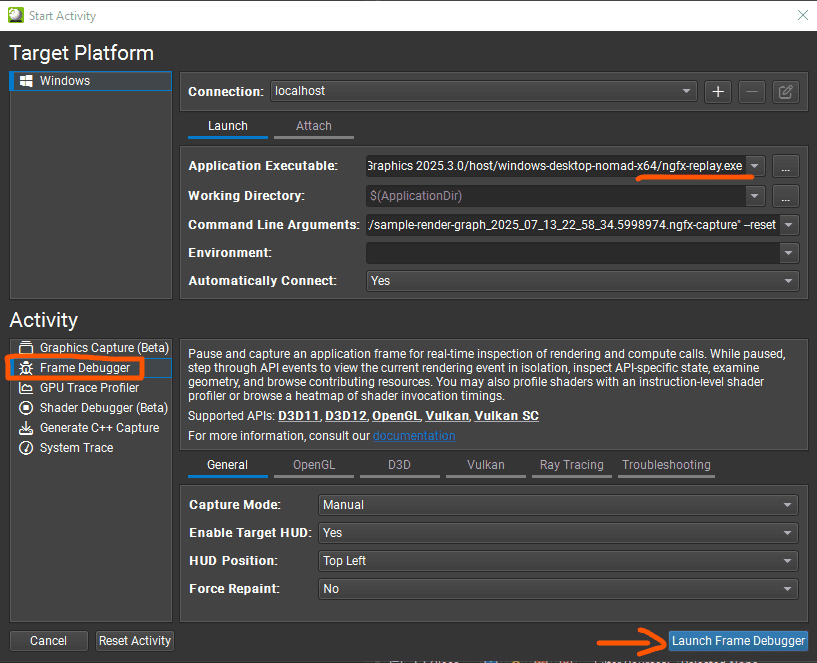
:center-px:
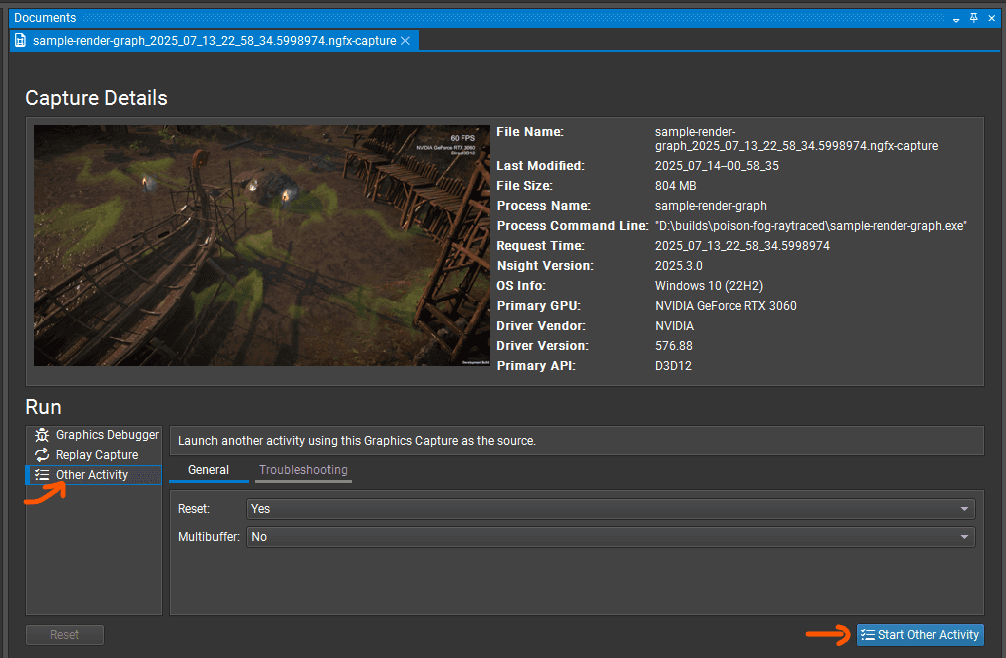
Upon starting another activity, Nsight displayed the activity wizard again. Notice that the target application on the new activity wizard is ngfx-replay.exe, not the previously set build. This is the application that will render the captured frame over and over again. Now you can open this frame using Frame Debugger or GPU Trace Profiler. Since Frame Debugger provides basic timings for the rendering, I will use it first to see how the fog is being rendered.
:center-px:
:image-description:
After launching Frame Debugger, a new application will show up with a Frame Debugger widget. The frame appears frozen because it repeatedly renders a single frame. The rendering works, but it is just not moving.
I pressed F11 to start the Frame Debugger.
:center-px:
After starting the Frame Debugger, a new window appeared. It allowed me to skim through the rendering of the frame. Look at this video:
However, the most interesting part happens in the Nsight Graphics window. It displays all the draw calls and allows you to browse through each GPU event and look at all resources on the GPU.
This window can be pretty overwhelming, so I will skim through the most critical parts.
:center-px:

___
4. Interpreting the Frame Debugger
Now I will shortly explain what each of those windows is, giving you an idea of how to use the Frame Debugger. Frame Debugger provides similar information to the Render Doc, with additional information about event timings.
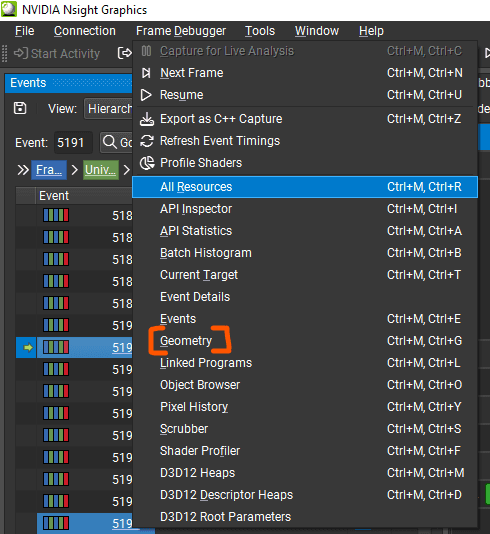
You can use the Frame Debugger menu to open new windows. You may want to have an additional Geometry window opened for debugging the meshes.
:center-px:
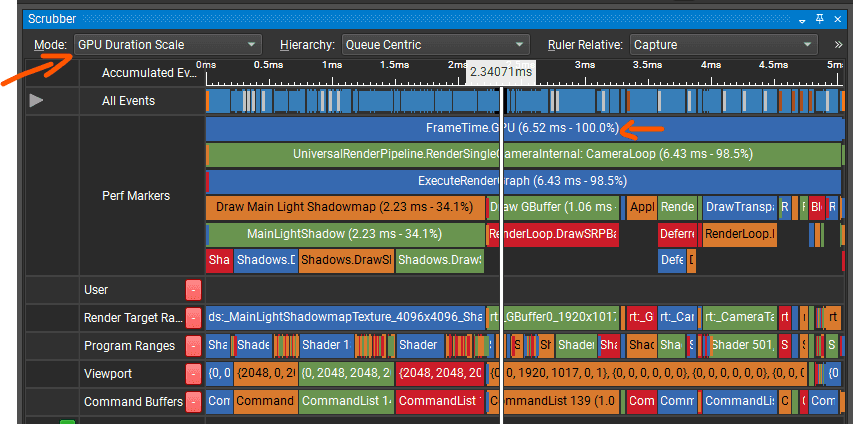
Scrubber
It displays all the draw calls on the timeline. I highly recommend using a GPU Duration Scale mode here to see how long each draw call executed. Draw calls are represented by the blue rectangles at the top (All Events row). They are grouped with some performance markers. You can hover over a marker to see how long it took to draw..
In my case, a big chunk of the rendering time is taken by rendering a shadowmap for a directional light. It would be reasonable to start the optimization from that. I would search for a fog draw call under the DrawTransparentObjects performance marker.
:center-px:
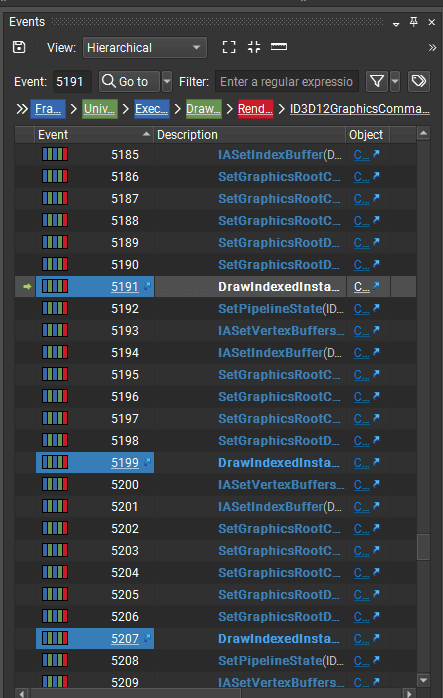
Events
The Events window is always in sync with the Scrubber. When you select the event in the window, it will also focus the scrubber and other windows.
The events window contains all the API calls that the GPU received during this frame.
:center-px:

:center-px:
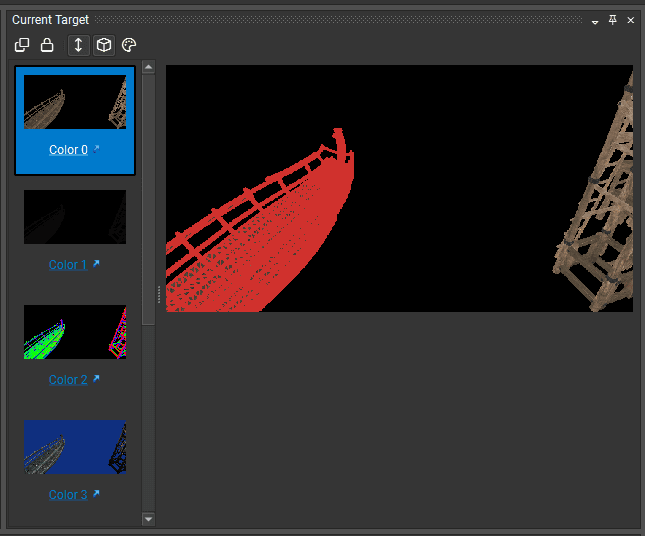
Current target
Shows what is stored in the render targets after executing the selected draw call. Here you can browse all the GBuffer/color, depth, and stencil buffer contents. You can click on each resource here to inspect its contents in more detail.
:center-px:
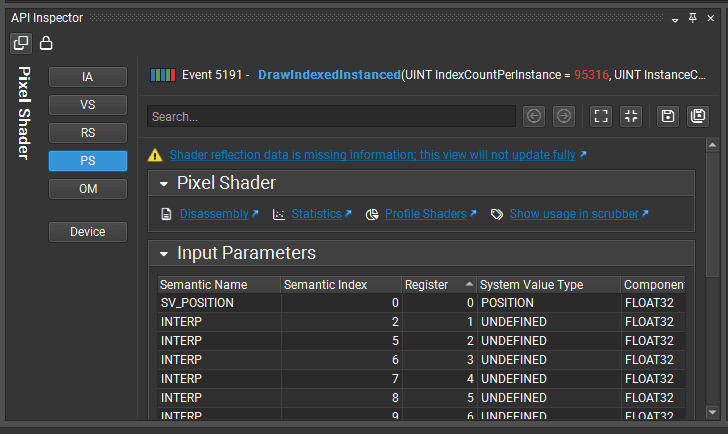
API Inspector
API Inspector shows the setup for the draw call resources. This reflects the GPU state during the rendering. Here you can see the vertex/fragment shader that was used. When using DX11, it also shows which textures are bound to the vertex and fragment shaders.
:center-px:
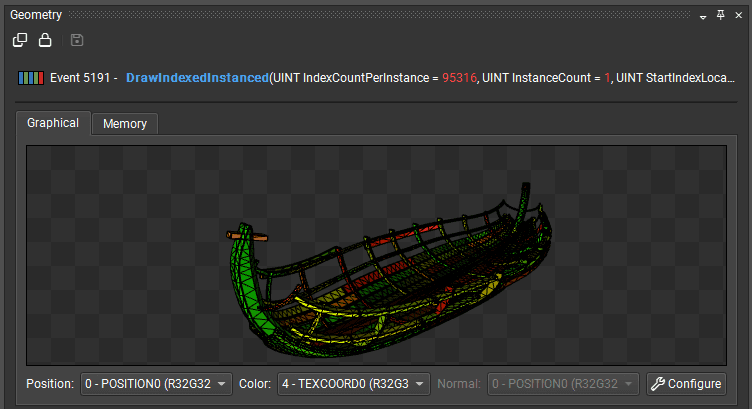
Geometry
This window allows you to inspect the vertex and index buffers of a rendered geometry.
:center-px:
Finding a specific draw call
My goal is to check how fast the volumetric trails render. I usually do those steps to find a specific feature:
1. I skim through draw calls to see when the effect appears.
2. I check the render targets to make sure I found the right draw calls.
3. I find the first draw call and the last draw call used to render the effect.
4. If those draw calls are rendered in a one chunk, I insert a user-marker to measure all of them at once (Left Shift + Mouse drag on User section in the scrubber).
I was able to identify four draw calls of fog and measured the time for the mist to be 0.55ms for this frame.
I recorded a whole routine, you can see me in action below.
Here, you can also see that the Current Target window doesn't always show the raw texture contents. It always normalizes the displayed color range. When there is a very bright pixel in the texture, other pixels will appear in much darker colors. In this case, I look at the contents of the rendered texture in the Resource window, which can be opened by clicking on the texture.
It is essential to recall which events were used to create the fog.*It will be useful when using the GPU Trace Profiler. In this case:
4 consecutive events that use the same shader.
Events under the DrawTransparentObjects marker.
Rendering of those events takes ~0.55ms.
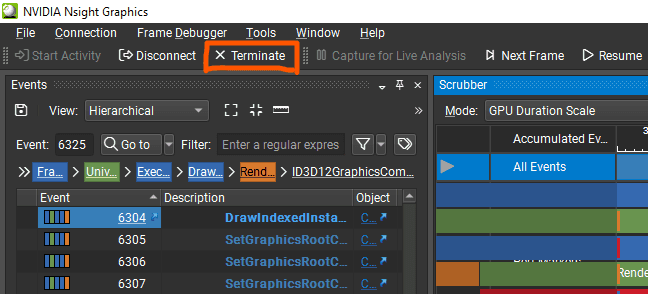
I can get more details about those draw calls when using GPU Trace Profiler. I close the frame analysis by using a Terminate button. It immediately kills the app that is analyzed.
:center-px:
5. Interpreting the GPU Trace Profiler
I used the same frame capture again to launch the GPU Trace Profiler.
:center-px:
:image-description:
The GPU Trace Profiler is a window that provides detailed data about the frame's performance.
The differences between Frame Debugger and GPU Trace Profiler:
GPU Trace Profiler is not so interactive. After I click the draw call, I can't see its resources or what it changed in the render targets.
GPU Trace Profiler provides super detailed performance data - it shows throughput of most important GPU hardware pieces, while Frame Debugger only provides basic timings.
:center-100:
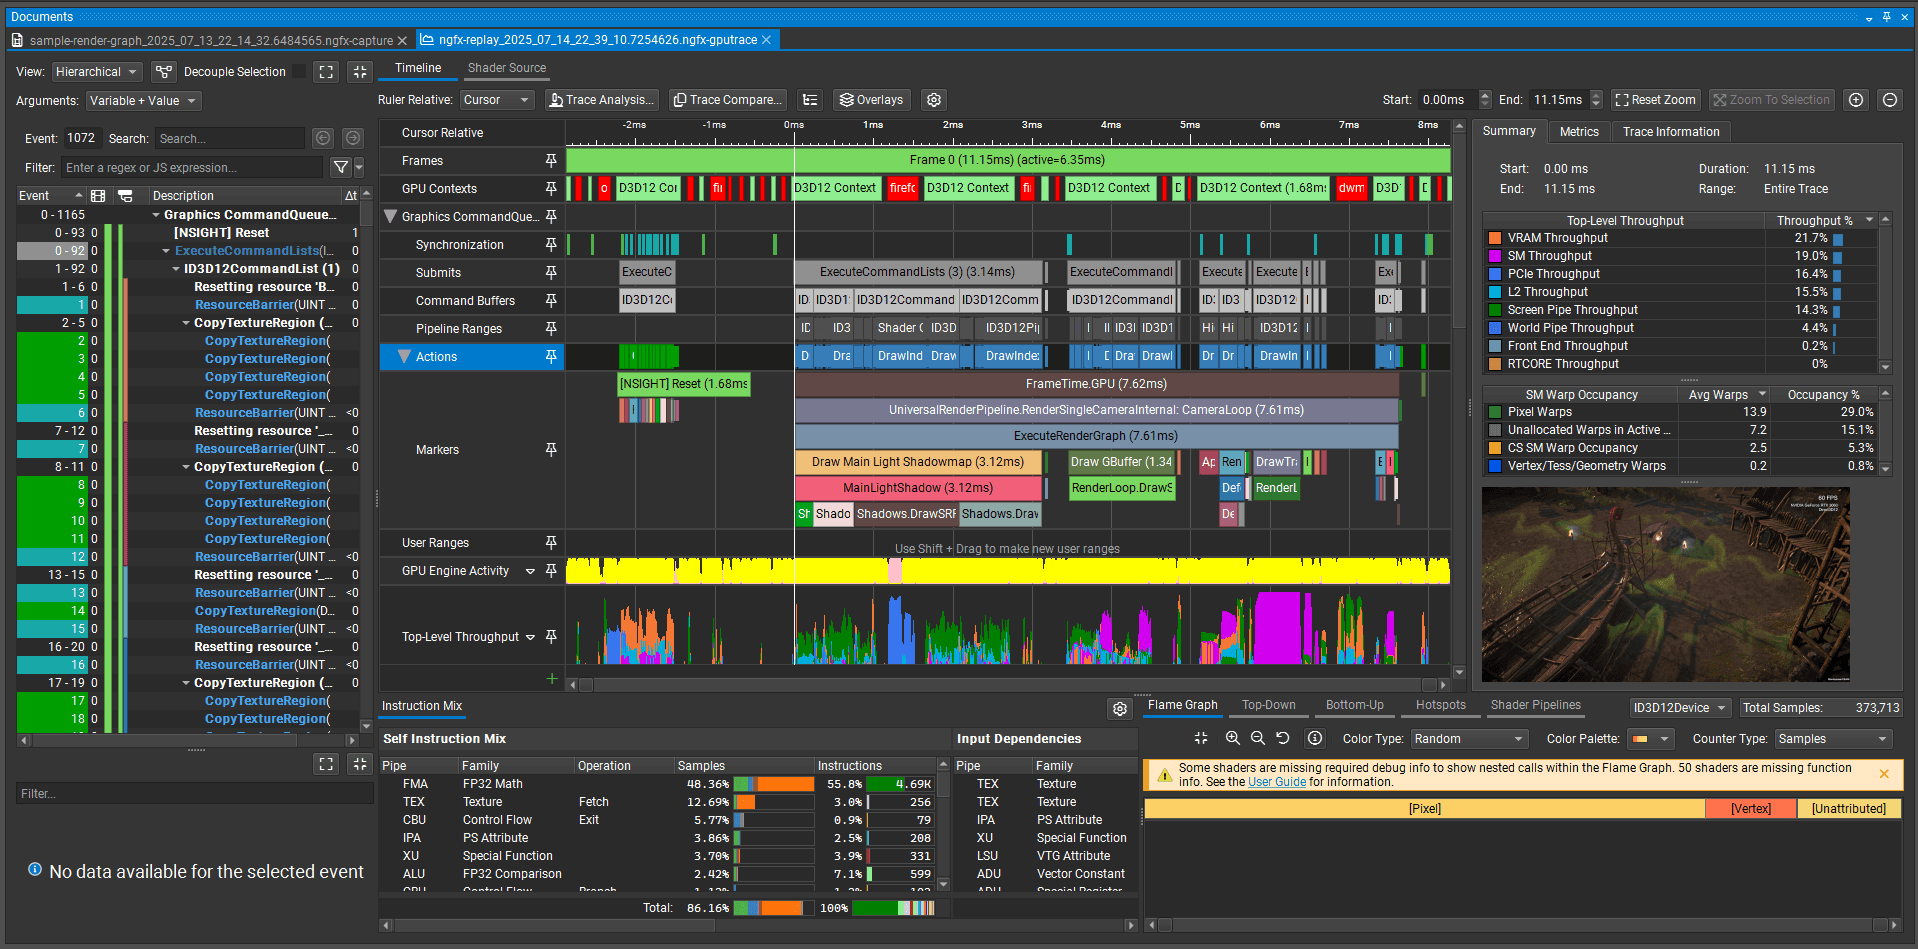
Let's skim through the various sections of this window.
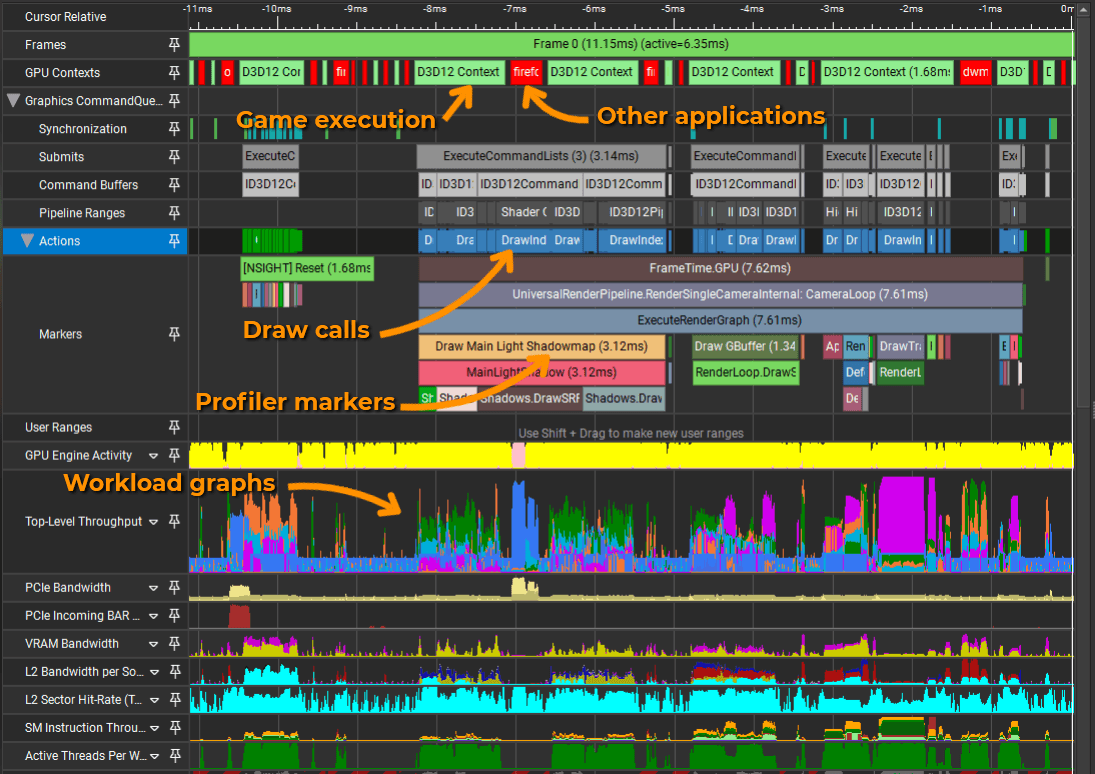
Timeline
Timeline provides similar data to a Scrubber. Here, you can see the events on a more detailed timeline, including GPU interruptions by other applications (e.g., web browsers).
When hovering over the contents, more detailed data is displayed.
:center-px:
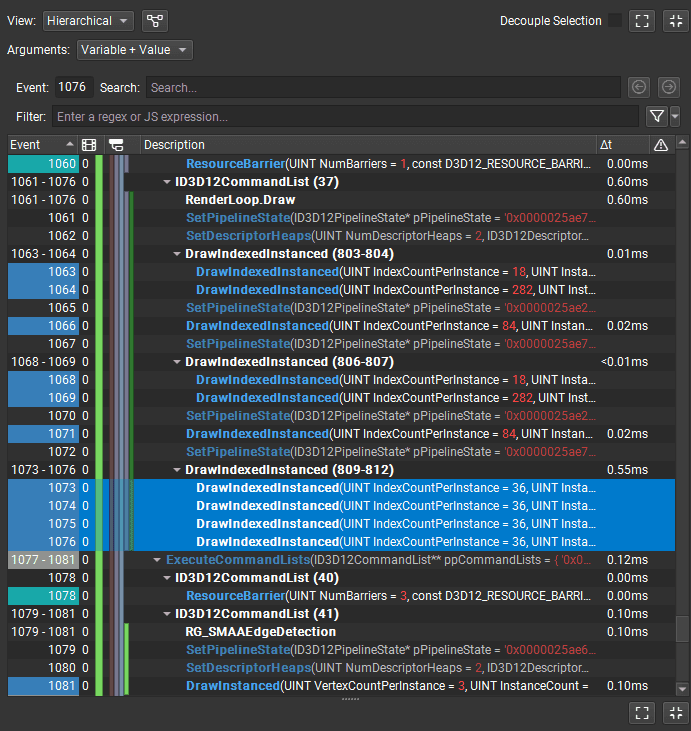
Events
Similar to the Events in the Frame Debugger, this is a list of events sent to the graphics API by the game. Selecting the event will select it in other windows and vice versa.
:center-px:
Summary and metrics
The summary contains the most important performance metrics, along with selected throughputs of various GPU units. At first glance, it may be unintuitive what those abbreviations are.
It is essential to remember that the unit with the highest throughput is often the one that bottlenecks the rendering process.
So in this case, if SM Throughput is at 93% of its maximum, I should focus on optimizing for SM units.
:center-px:

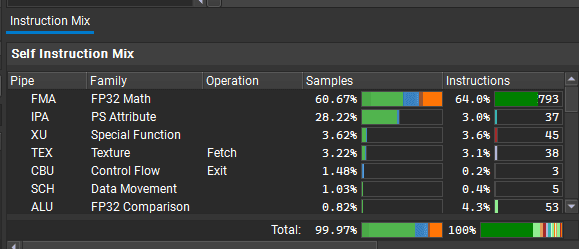
Shader instructions
Instruction mix shows you what specific hardware units were used inside the SM Unit when executing shaders in the selected range.
In this case:
60.67% of the shader time is spent on a simple floating point math
28.22% of time is spent fetching the interpolated fragment shader values
3.62% - special function
3.22% - sampling the textures
:center-px:
And when expanded, you can see the main reasons why the GPU was unable to perform any operations when executing the shaders.
Stalls are the reasons why the GPU couldn't do anything. So, if there is a 93% throughput of SM units, the remaining 7% is spent waiting, if you want to optimize this "waiting" time, you should focus on the stall locations.
:center-px:
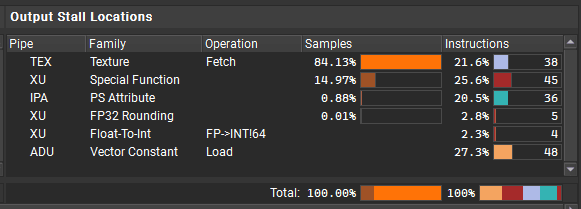
In this case:
84.13% of waiting time was spent waiting for texturing units to complete texture fetches - optimize texture fetches to optimize waiting times.
14.97% of time was spent waiting for a special function to complete (XU is responsible for division, log, square root, sin, cos, etc.)
Profiling the fog and analyzing the results.
Now I will use the GPU Trace Profiler to measure the performance of the fog and see how I can optimize it.
Locating the draw calls
I noted from the Frame Debugger that the fog is rendered by a single shader in 4 consecutive draw calls under the DrawTransparentObjects marker. I will use this information to quickly locate the fog draw calls in the GPU Trace Profiler.
Again, video of me in action:
Analyzing the throughputs
Let's analyze the top-level throughput (throughput of various GPU units):
:center-px:
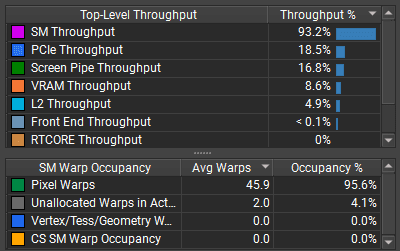
SM Throughput is at 93.2%. I should optimize the rendering for SM units to improve performance. Other GPU units aren't used so much, so they are probably waiting for SM units to complete their workload first.
Additionally, I can see that 95.6% of SMs were used to execute Pixel Warps.
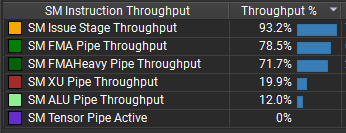
I also found some metrics just about SMs:
:center-px:
Understanding the throughputs
How do I use this information to decide what to optimize? I will read about the SM units and Pixel Warps to understand what they are responsible for. I usually look for this information in documents and blogs from Nvidia or other GPU vendors. Lately, I often ask Chat GPT to explain or do the search for me.
Note: It is important to ask AI only about specific units on the GPU and to do the thinking yourself. Don't ask AI to analyze the throughputs for you because AI can't reason about it - it usually suggests the most common bottlenecks instead of conducting a thorough analysis. I send the screenshots for analysis into Chat GPT but its response was (in short) "High utilization of the GPU, so you need to reduce batches, simplify geometry, reduce texture sampling and simplify shaders". It is a super generic advice. Look at my analysis, you will see why this response was absurdly stupid.
So, what are SM units?
In short, they execute your actual shader code (except the texture sampling, which is delegated to the texturing units through Long Scoreboard).
:center-px:
So 93% of SM throughput means that:
93% of the GPU time was spent executing the vertex or fragment shader code.
7% of time was spent waiting.
:center-px:
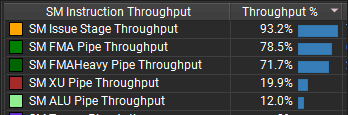
FMA Pipe was at 78.5%. This pipe is responsible for basic math on floats. Any addition, multiplication (including matrices and dot products), is performed by those units.
FMAHeavy Pipe (71.7%) also does basic float operations, but it can also do integer operations (on Ampere GPU architecture).
:center-px:
Most of the time was spent executing Pixel Warps, which means that most of the time was spent executing the fragment shader.
Final verdict
To summarize:
The slowest part of rendering the fog is the fragment shader that uses a lot of basic float math (additions and multiplications). To optimize the fog, I need to reduce the usage of math operations in the fragment shader. That's it.
It's also good to remember that when the rendering is fragment shader bound, reducing the amount of fragment shader invocations will always help. So naturally, lowering the size of the fog (coverage of the screen) and lowering the number of fog objects will always improve the performance.
It also means that:
Texture sampling is NOT a bottleneck - reducing texture samples or resolution will not make the rendering faster
Fetching vertices is NOT a bottleneck
Too many vertices are NOT a bottleneck
High triangle density is NOT a bottleneck
Rasterizing triangles is NOT a bottleneck
Depth testing is NOT a bottleneck
Poor batching is NOT a bottleneck
Overdraw is NOT a main bottleneck, but lowering the number of pixels covered by the fog will improve the performance, because it is pixel shader bound.
___
Summary
Unity lacks a built-in GPU profiler.
Profiler != debugger - profilers show performance bottlenecks, debuggers show rendering correctness.
Native GPU profilers provide detailed GPU timings and throughput data. Pick up a profiler created for your GPU.
My profiling process: install Nsight, launch as admin, capture frames, analyze using Frame Debugger (basic timings) and then GPU Trace Profiler (detailed metrics).
Learn about the GPU architecture - understand the performance metrics to make correct optimization decisions based on the measured data, not assumptions.