Rendering
Deep dive
Basics
Beginner
Optimization
Everything I know about the overdraw
12 min

I think there are many misconceptions about overdraw. You have probably seen tools that visualize it: Unity's overdraw mode, RenderDoc heatmaps, or debug views that paint the scene orange and tell you that 8x overdraw is bad.
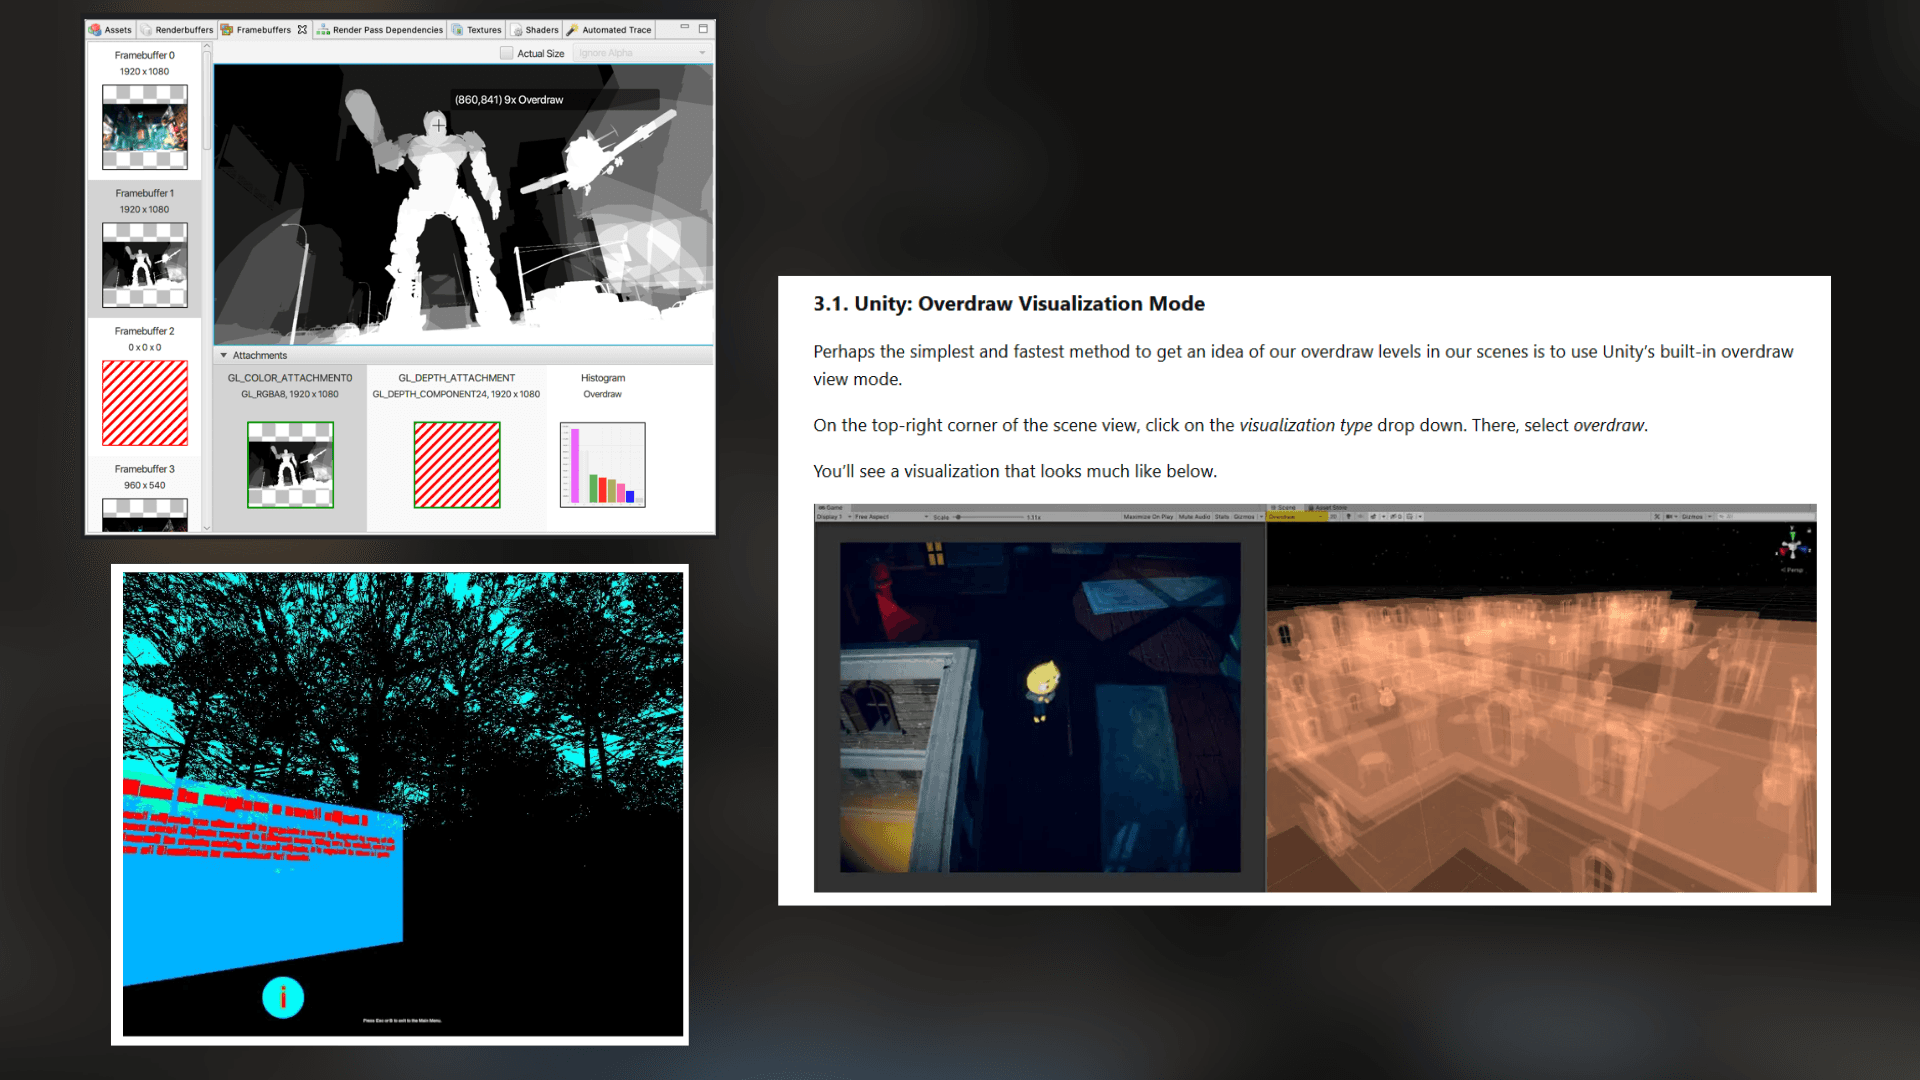
There are also many articles and videos about reducing overdraw. However, many do not show profiling results from before and after the optimization. They reduce the orange area in the debug view and assume the game is now faster.
I think this is the wrong way to look at it. Our goal is never not to reduce overdraw. Our goal is to reduce frame time.
In this article, I will show a scene that looks wrong in overdraw, implement a tool to remove hidden triangles, and profile the result on a mobile GPU. The result will surprise you!
In this article:
A scene that looks full of wasted overdraw and my attempts to optimize it.
A triangle-culling tool that should have reduced frame time but didn't!
The GPU pipeline, early-Z, and why hidden triangles can have almost no fragment-shading cost.
What overdraw actually is.
How the
discardinstruction and texture formats affect overdraw.How to handle transparency overdraw and opaque overdraw.
___
Overdraw views without a profiler
I often see a rule of thumb that says to start optimizing whenever the overdraw figure rises above X.
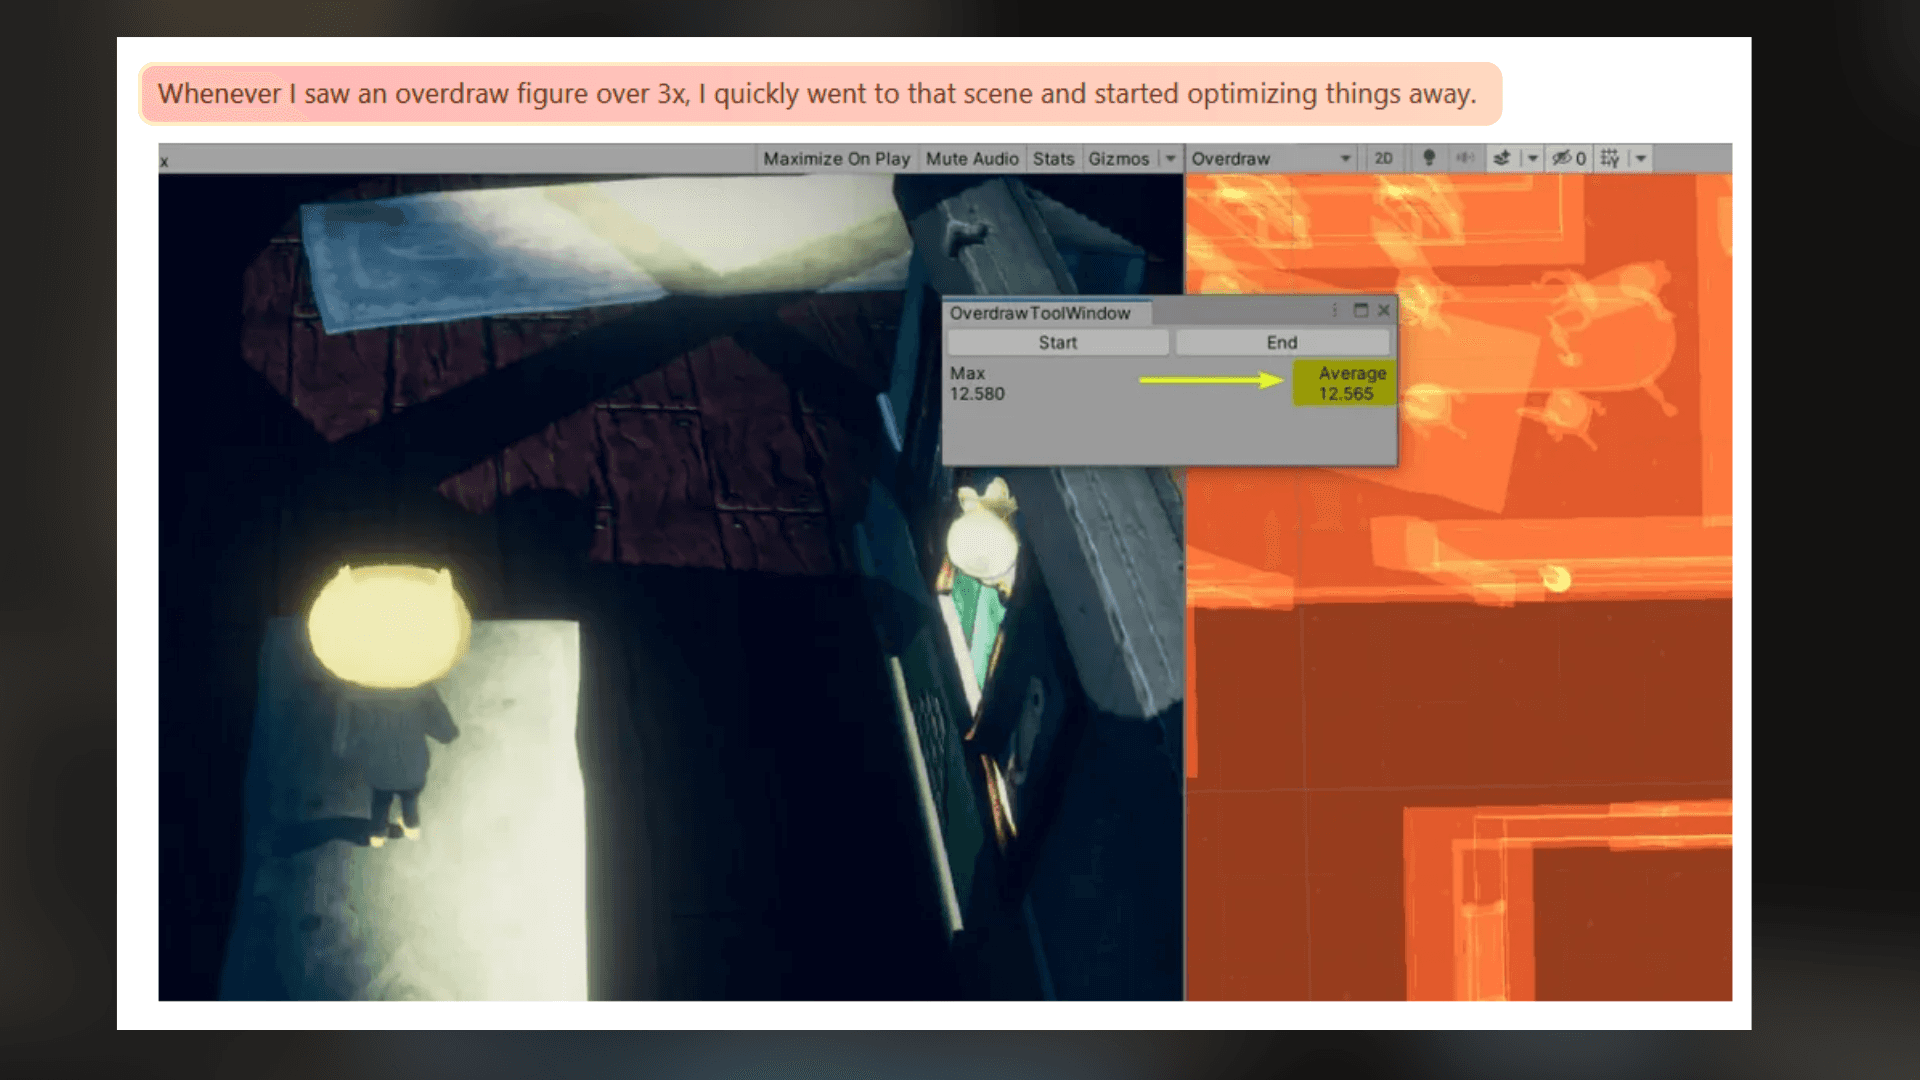
Look at that scene. The average overdraw is 12.5x. If I followed this advice, I would probably spend a day removing hidden geometry. But would the game actually run faster?
Many tips on the internet focus on reducing overdraw but rarely provide reliable profiling data. They show no frame times from before and after the change and give no information about the actual GPU bottleneck.
My conclusions I share in this article come from my own work experience and experiments across different devices, games, GPU architectures, and profilers.
___
The scene
This is my test scene. It has a low-poly island, transparent water, and a flat water bed under the mountain.
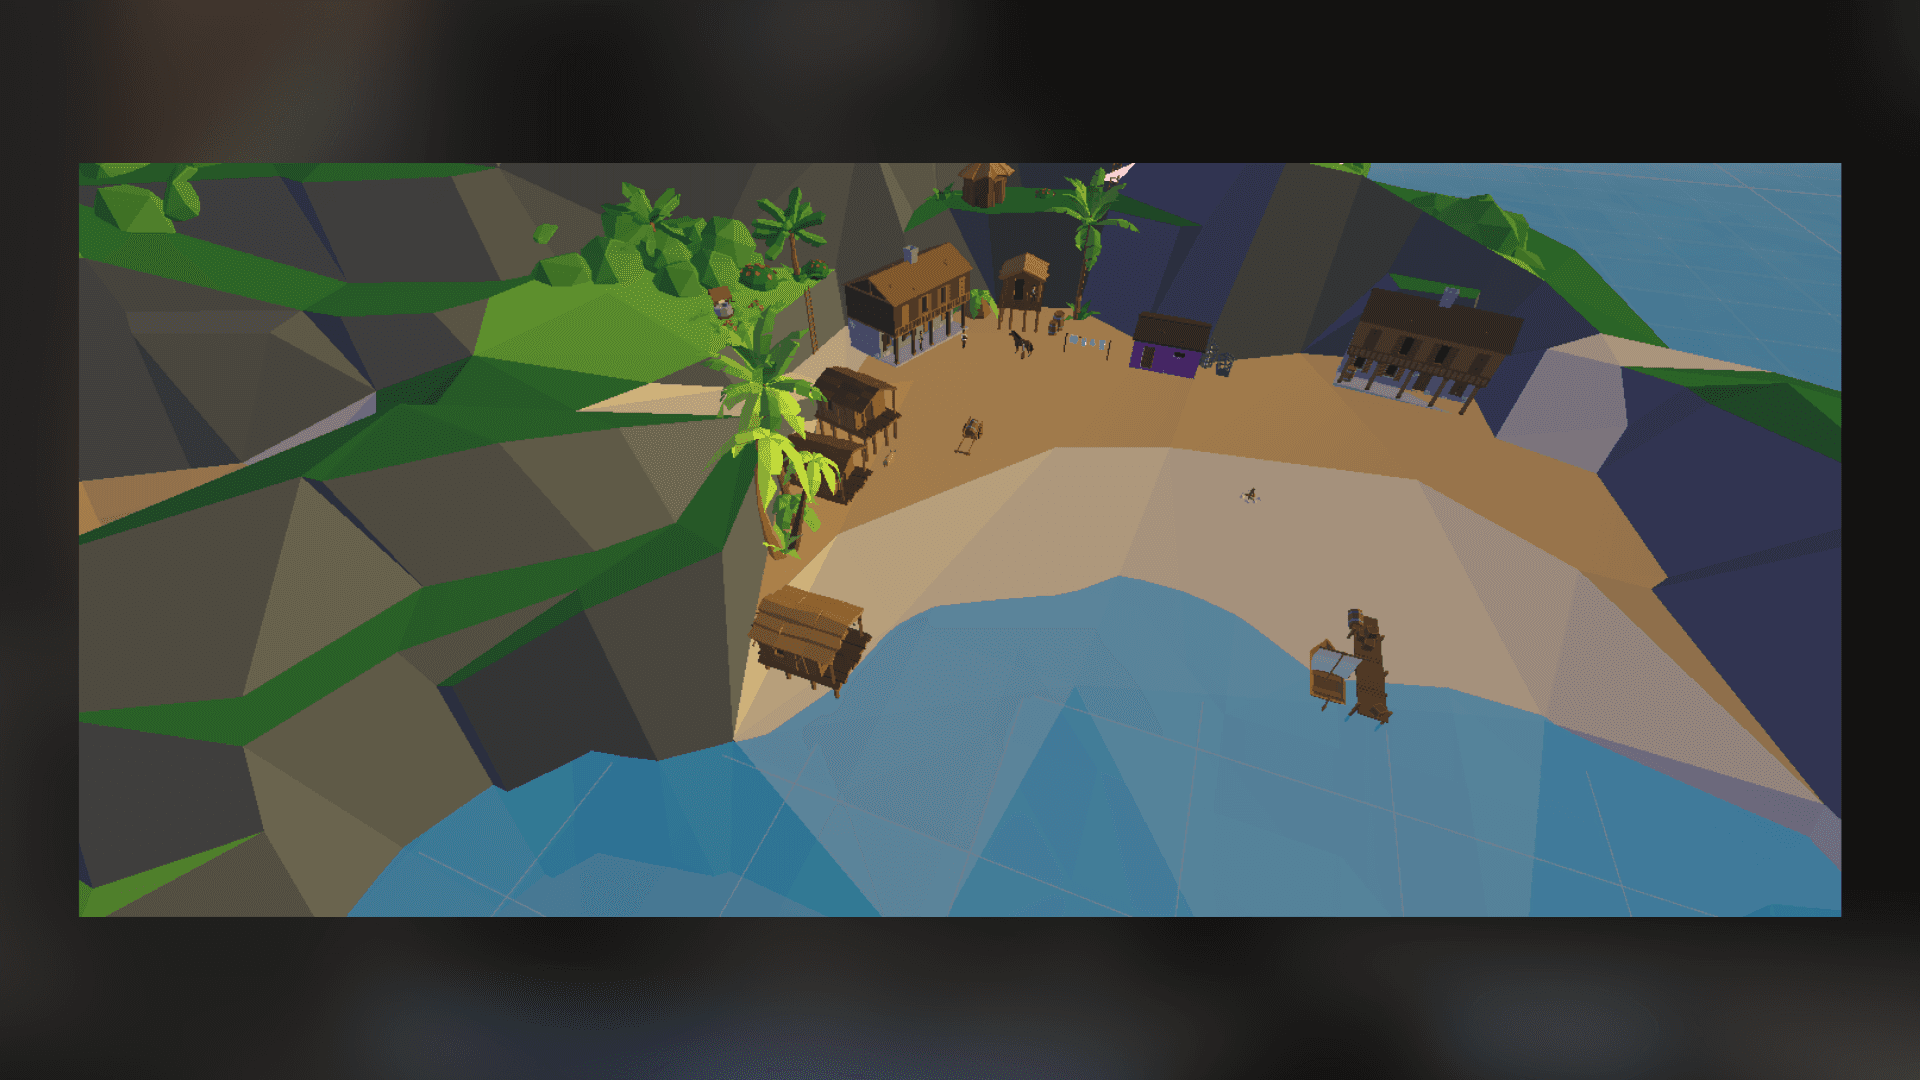
I profiled it on a Redmi 12 with an Arm Mali GPU. It is a budget phone I bought a few years ago. All captures in this section come from Arm Streamline - native GPU profiler for ARM GPUs.
___
How this frame is rendered
From the gameplay camera, you can see the beach, the mountain, and the water. But from the side, there is much more geometry hidden below the island.
The camera frustum covers only the top part of the island. Under the mountain, there is a full water plane and a flat terrain that the player never sees.

The rendering order looks like this:
Clear the color buffer.
Draw the mountain.
Draw the flat water bed.
Draw the transparent water.
Large surfaces are rendered under other surfaces. The water covers pixels that already have a mountain in front of them. The overdraw heatmap in some tools would probably light up.
So this is a perfect scene for testing whether removing hidden geometry actually improves performance.
___
Original capture
First, I profiled the original scene on the phone.
The frame takes 17.2 ms, with 8.45 million fragment shaders launched.
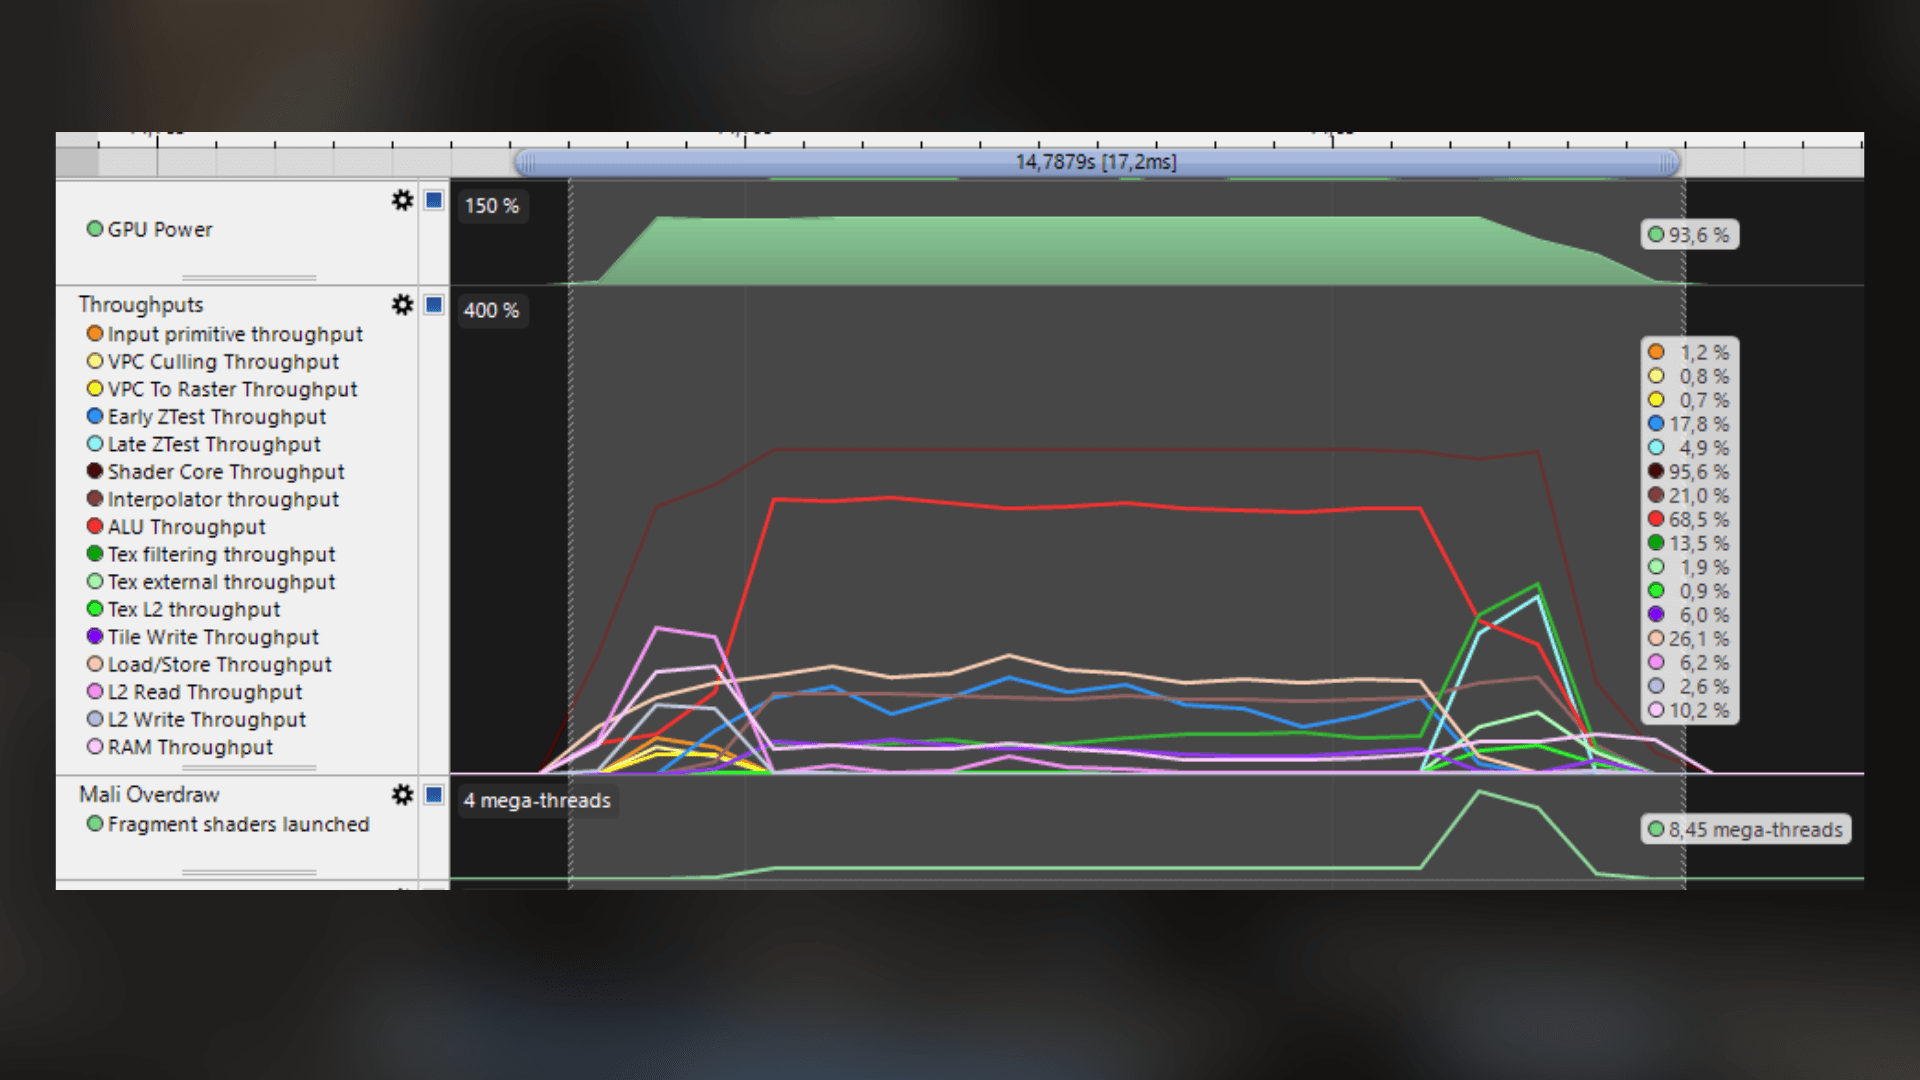
The shader core is almost fully used, and the fragment count is high.
Now I want to measure how much the water and the hidden terrain cost.
___
Delete the water and the water bed
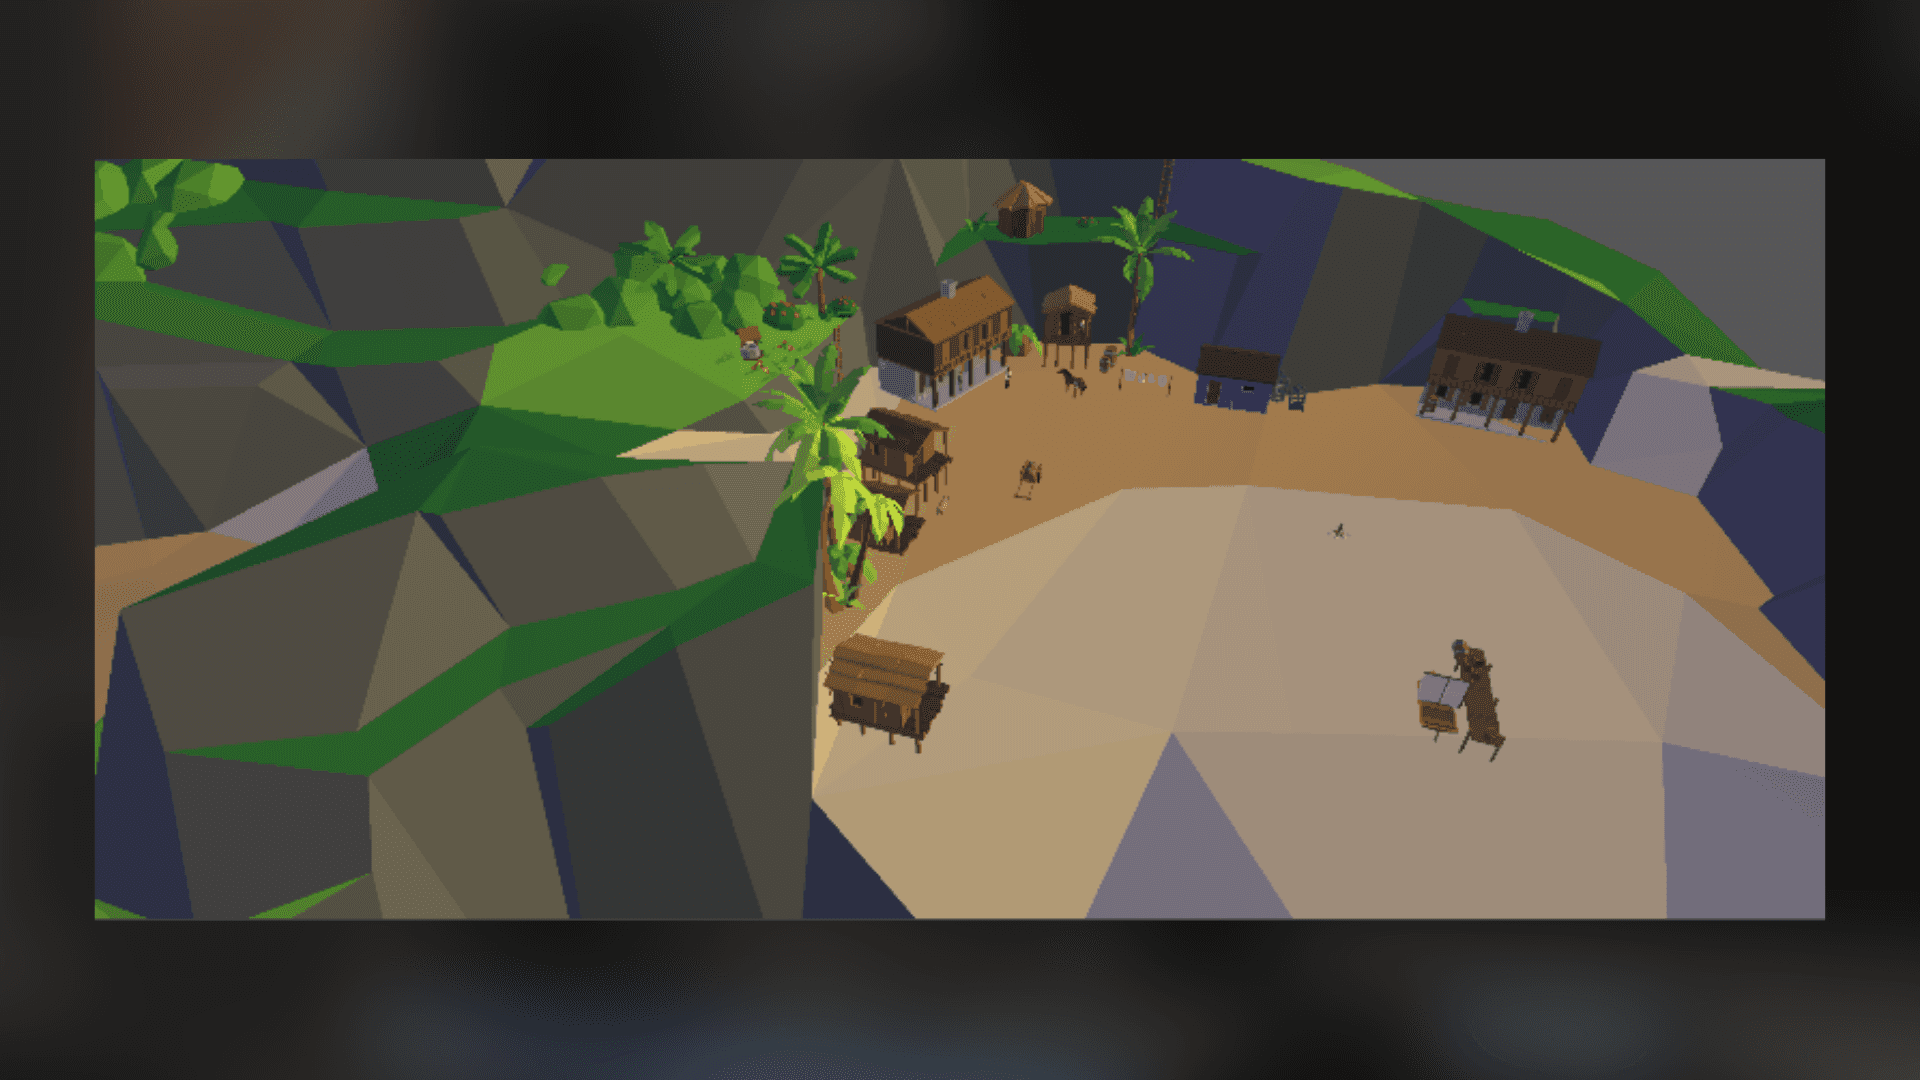
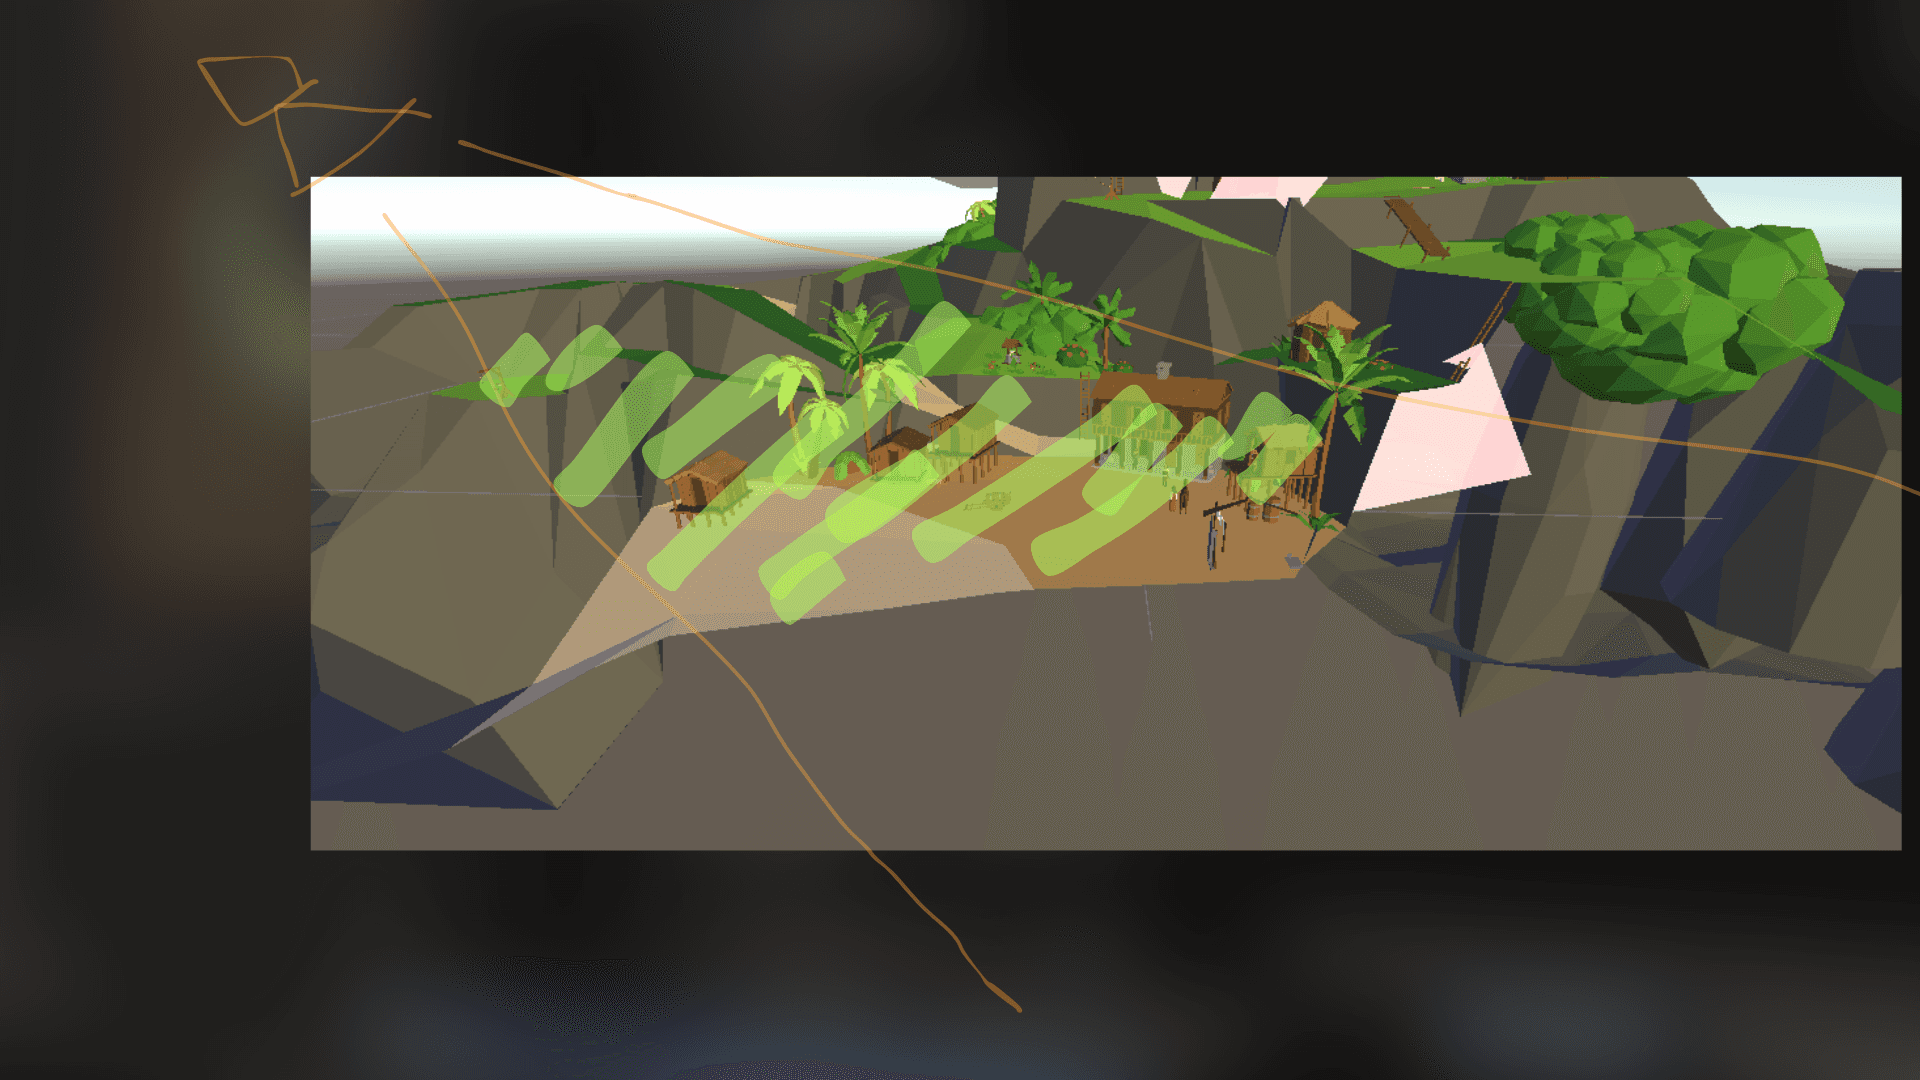
For the first experiment, I removed the water and the flat terrain completely. I did not cull individual triangles yet. I deleted both objects to measure their total cost.
This is how the scene looks without the water and the flat terrain:
And the side view:
Then I profiled it again.
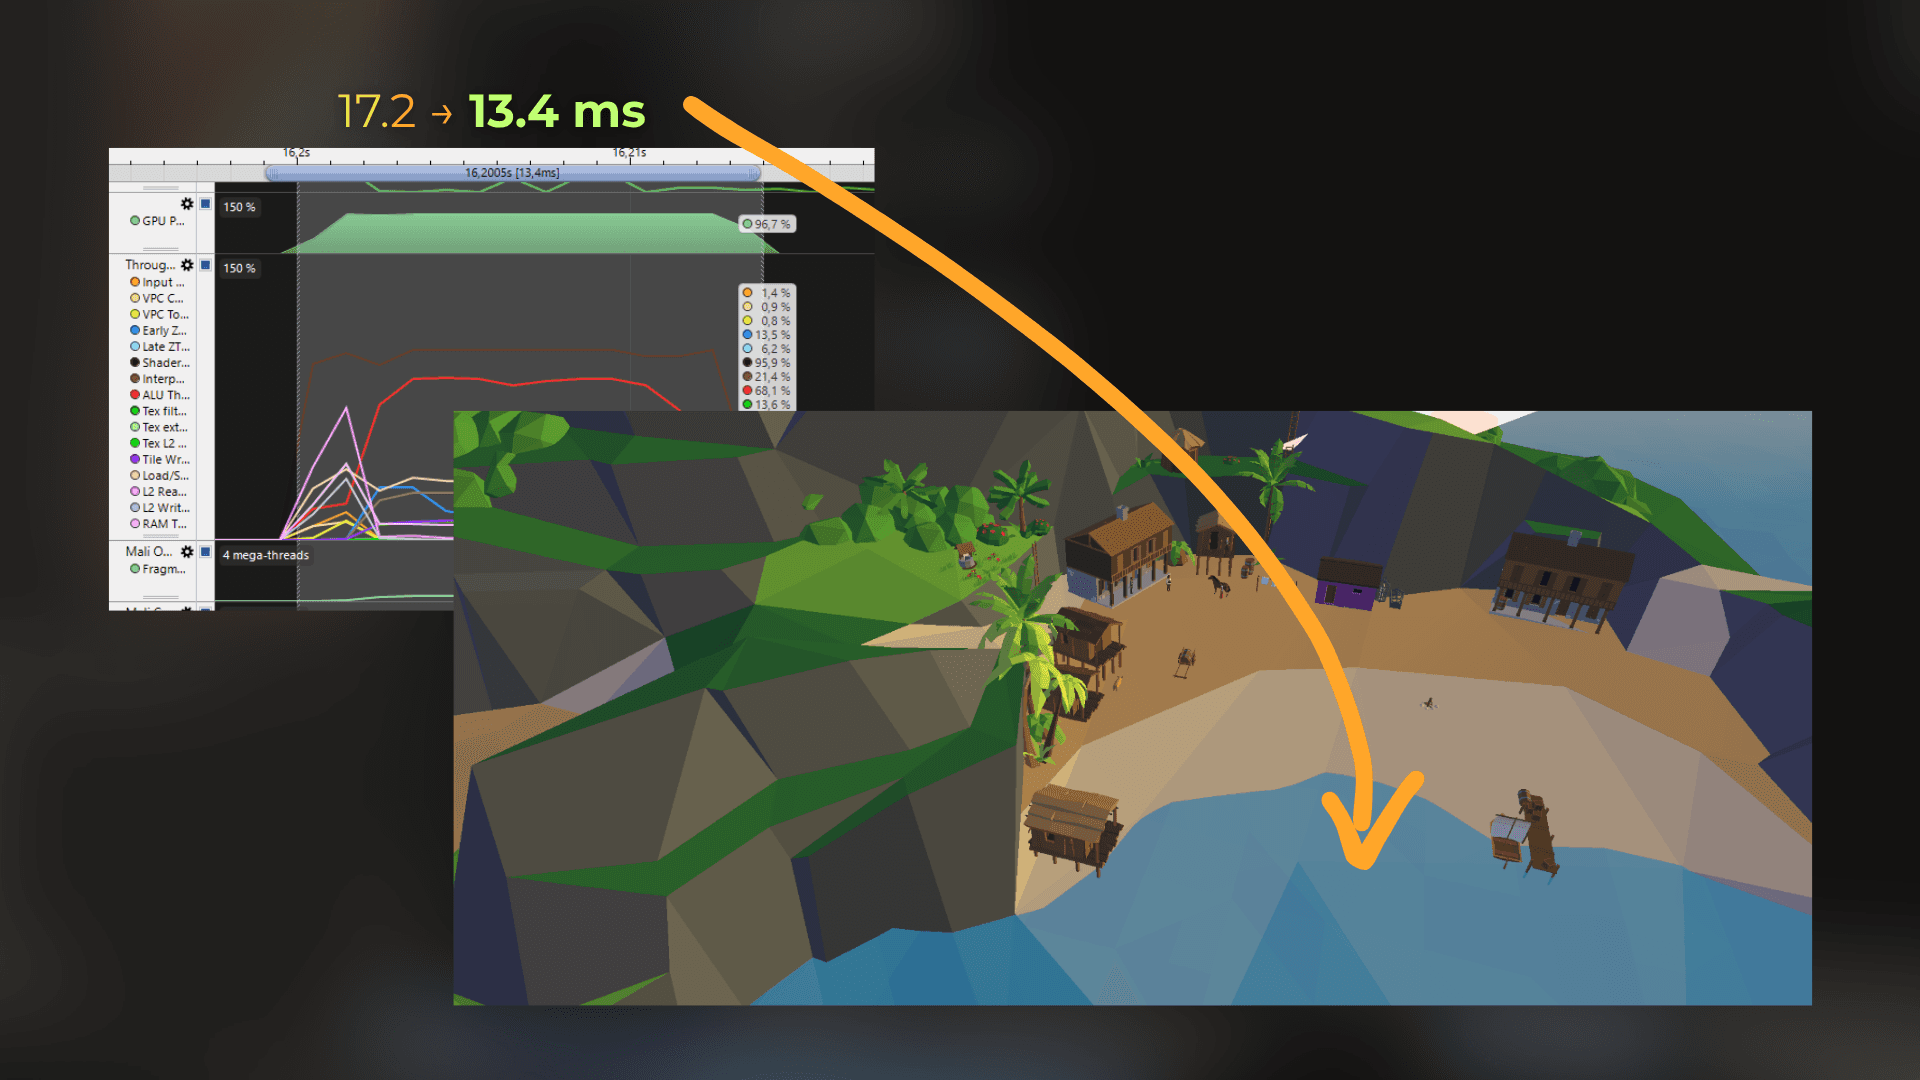
The frame now takes 13.4 ms, so it is 3.8 ms faster. The number of fragment shaders dropped from 8.45 million to 7.70 million.
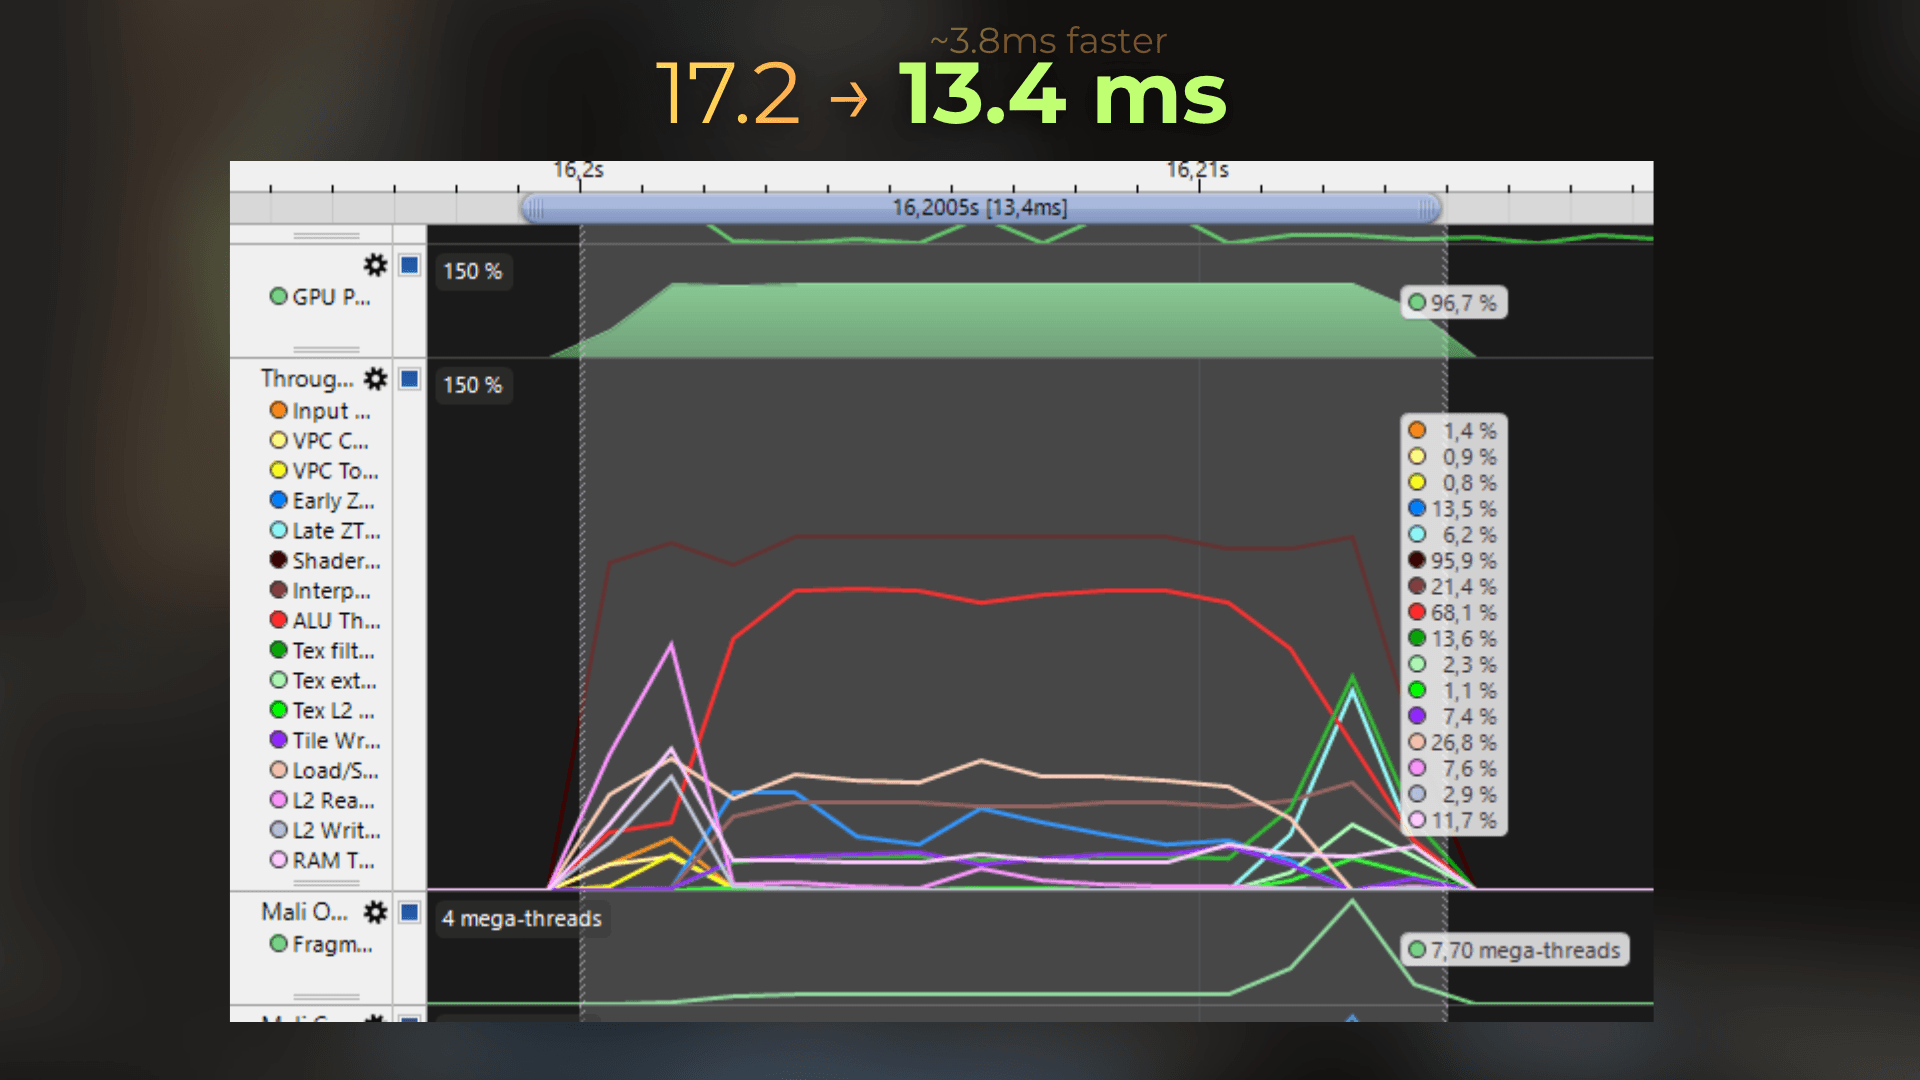
Nice. The water and the water bed cost 3.8 ms in total.
My next thought was: if I keep the visible water but remove the triangles hidden under the island, will I get a similar improvement?
___
Triangle culling
To test this, I implemented the simplest triangle-culling tool I could think of.
I can place a sphere in the scene, and any triangle fully inside this sphere is removed. A component bakes a new mesh when entering play mode or during the game build.
For each marked renderer, the baker creates a full copy of its mesh and changes only the index buffers. It checks every triangle against every culling sphere in the scene and removes the triangle if it is fully inside at least one sphere. A triangle that merely intersects a sphere stays in the mesh, avoiding newly clipped geometry.
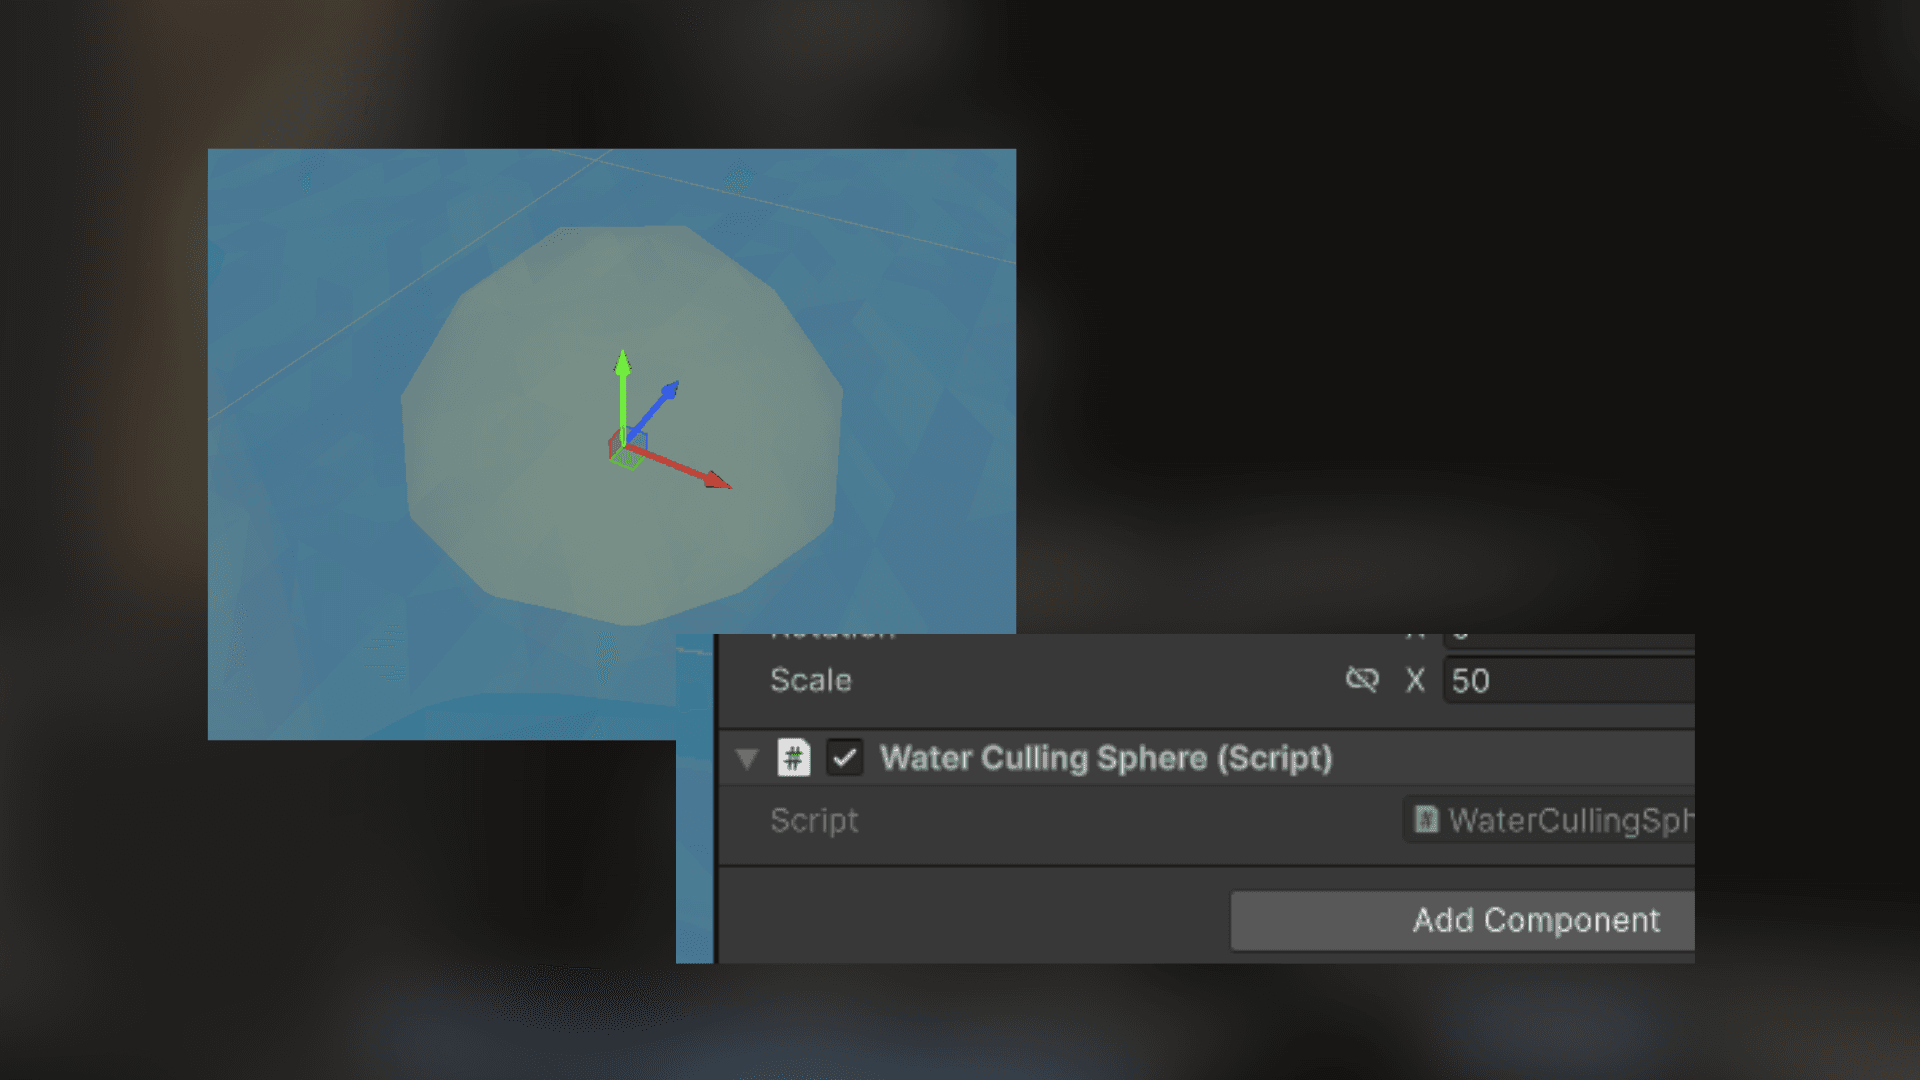
Below is a sphere that does the culling.
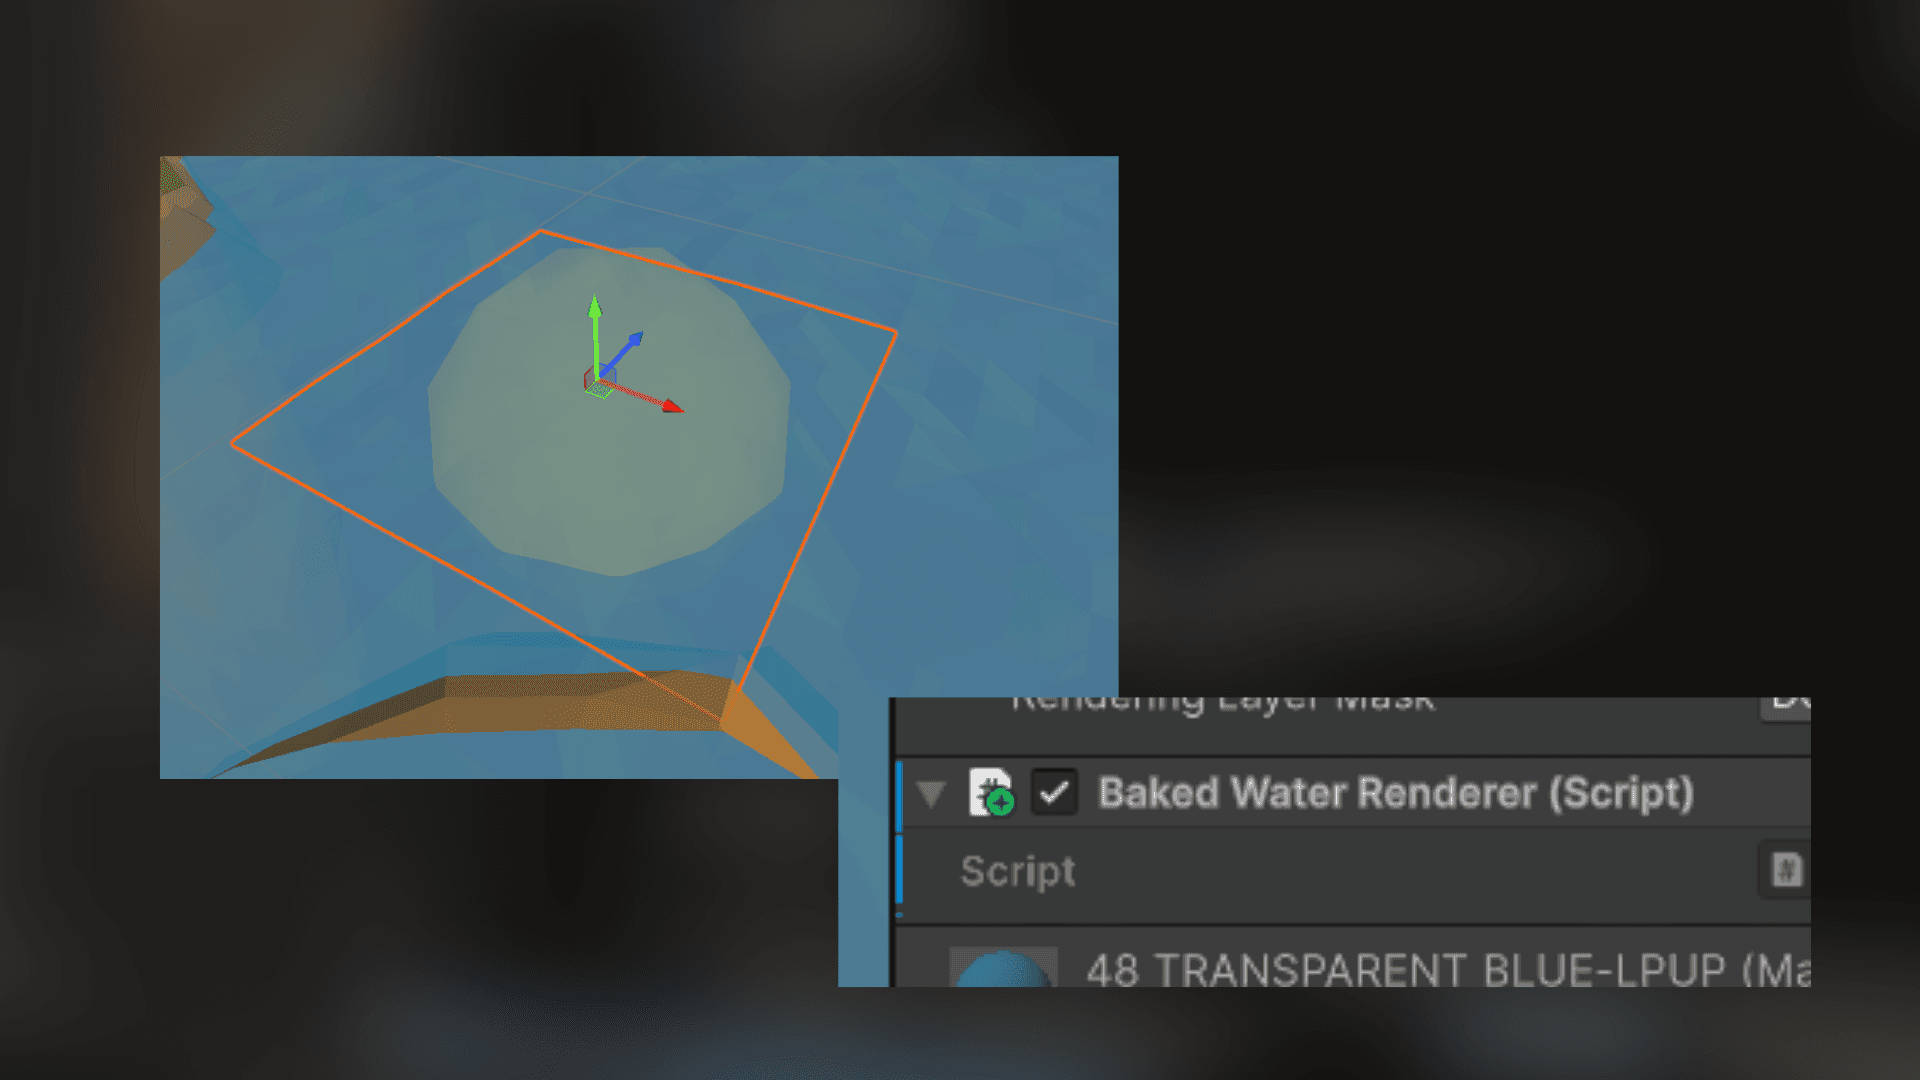
And I can mark renderers that should have their triangles removed.
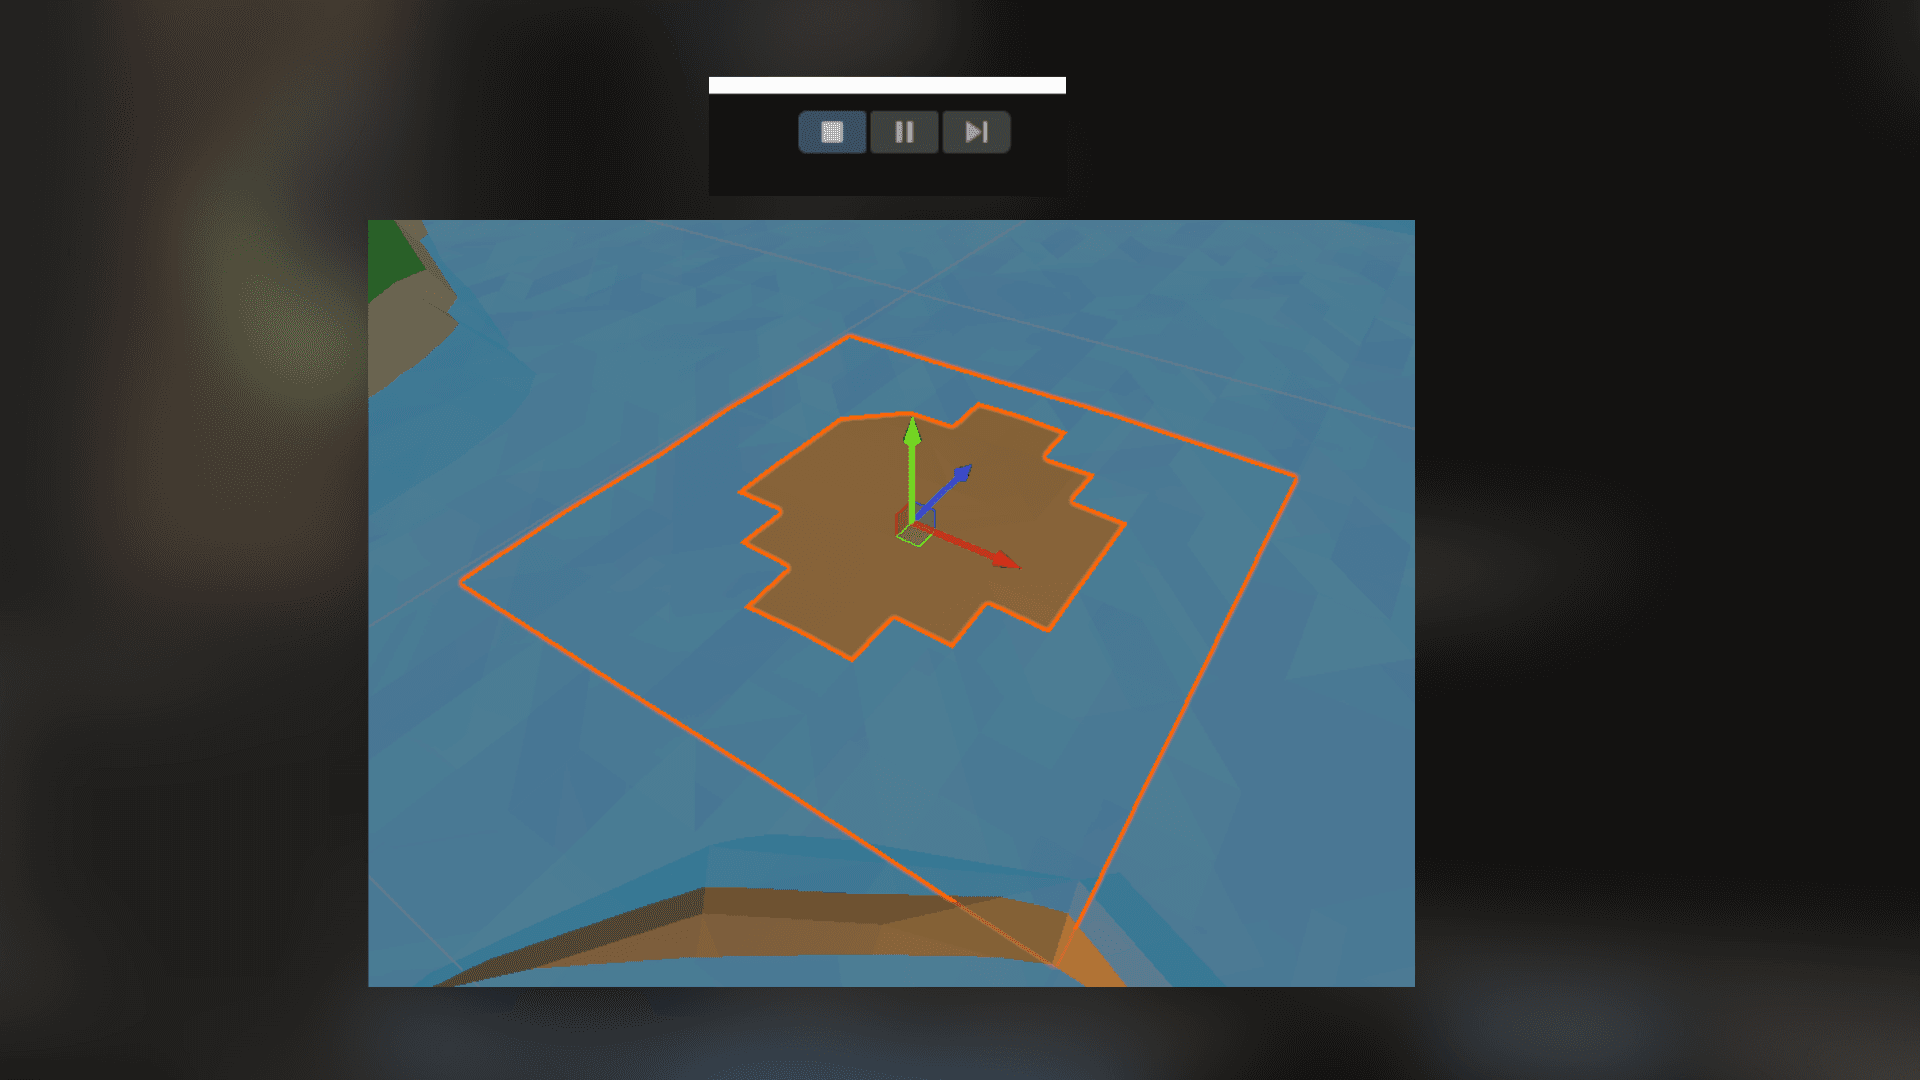
The baked water tile looks like this:
Then I filled the mountain with those spheres and baked both the water and the water-bed meshes.
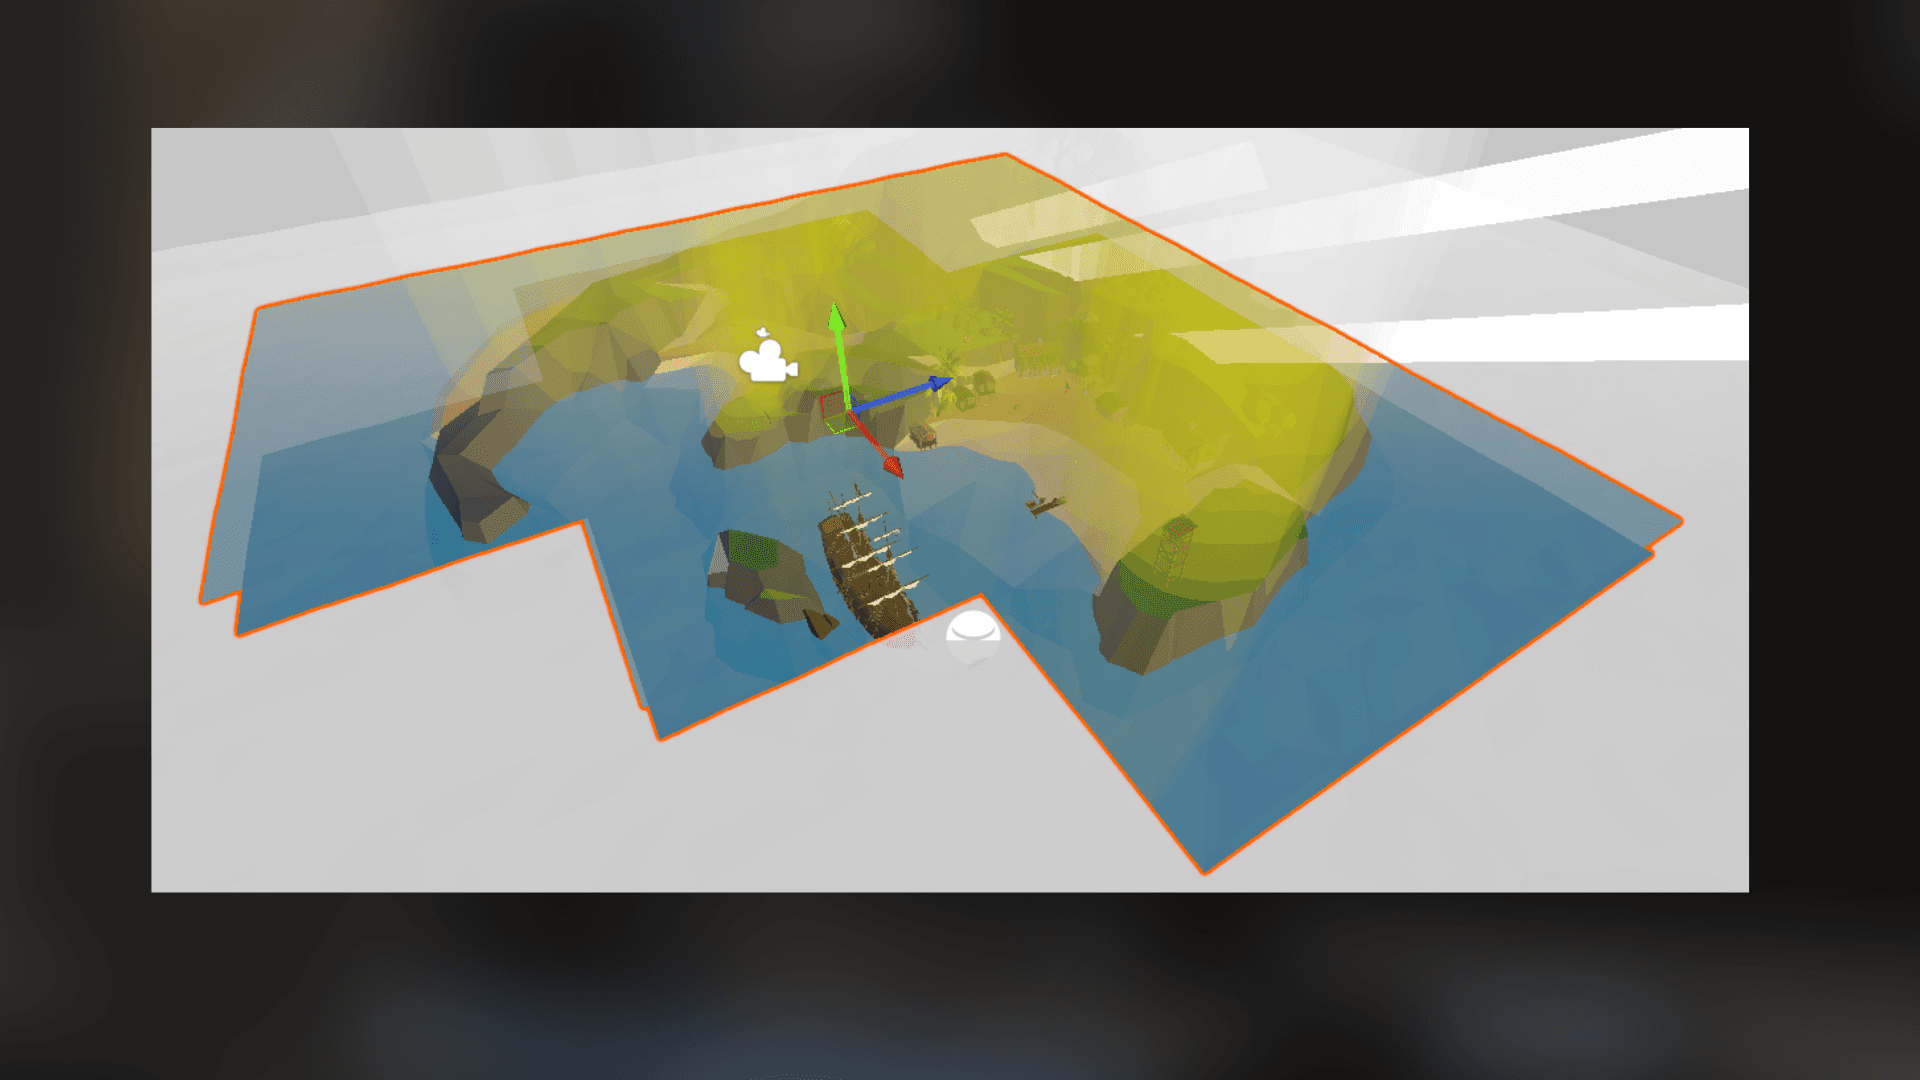
The hidden triangles are gone. From the gameplay camera, the scene looks the same.
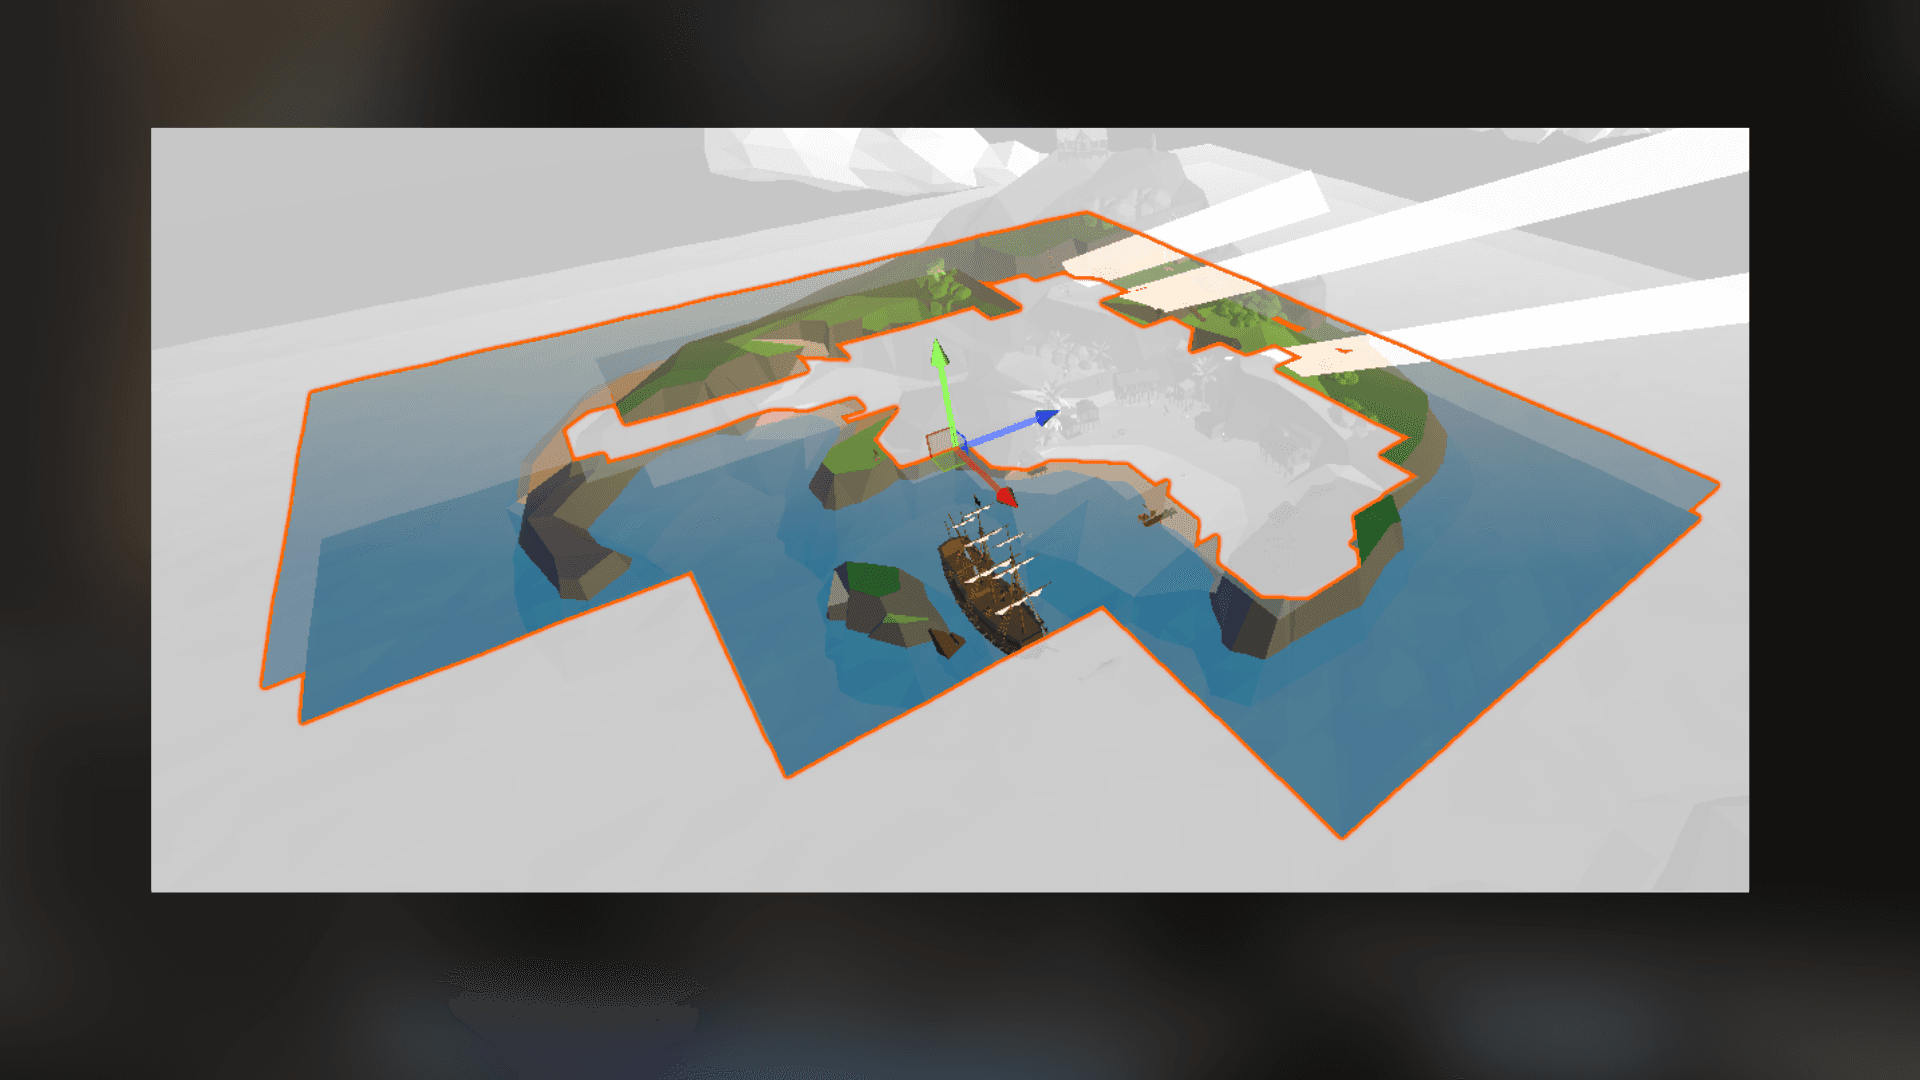
I removed most of the invisible water and terrain, so the frame should render faster, right?
___
Culled scene: only 0.3 ms saved
After I profiled the game, the time dropped from the original 17.2 ms to 16.9 ms.
Not 13.4 ms. The improvement is only 0.3 ms.
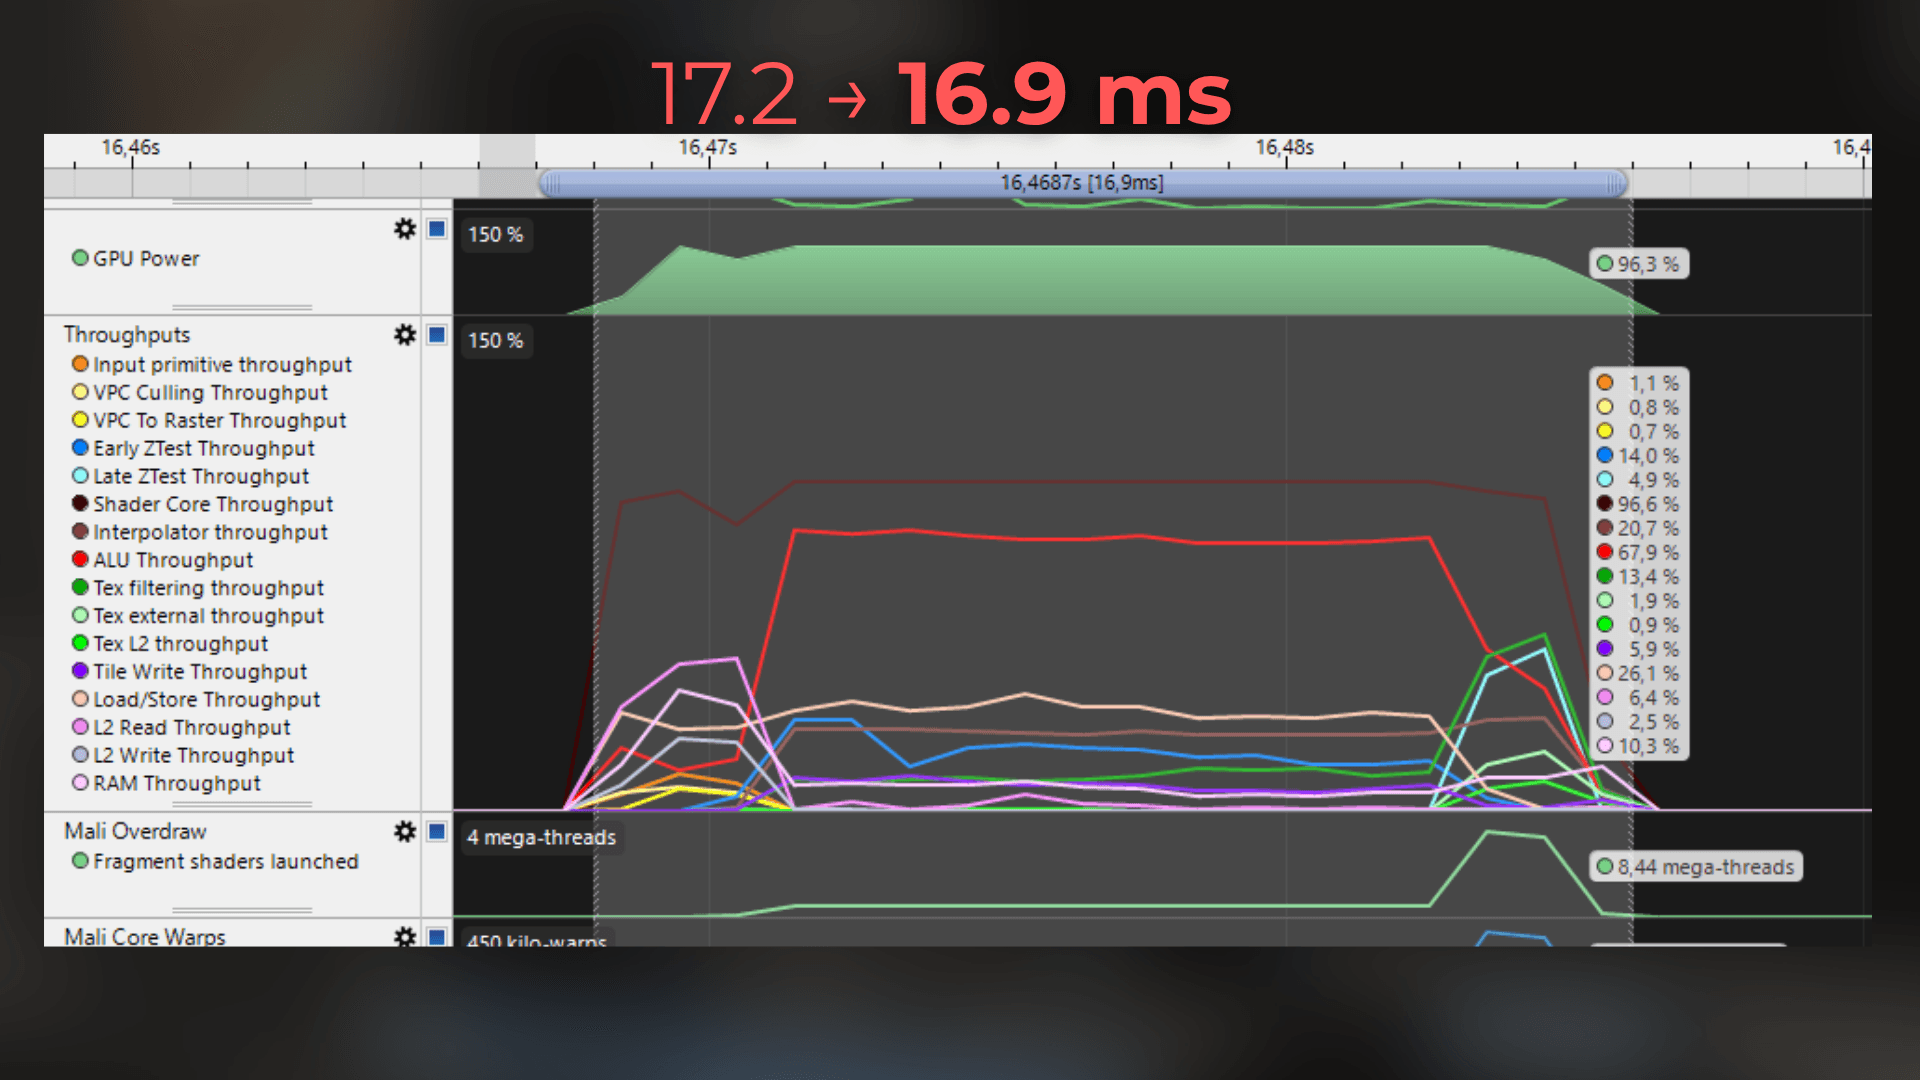
The number of fragment shaders went from 8.45 million to 8.44 million. Basically nothing changed here.
This means the 3.8 ms improvement from the previous test did not come from removing hidden triangles. Most of it came from removing the visible water - the pixels the player can actually see.
If I compare both Streamline captures, the only meaningful change is slightly lower early-Z throughput. The shader core stayed the main bottleneck.
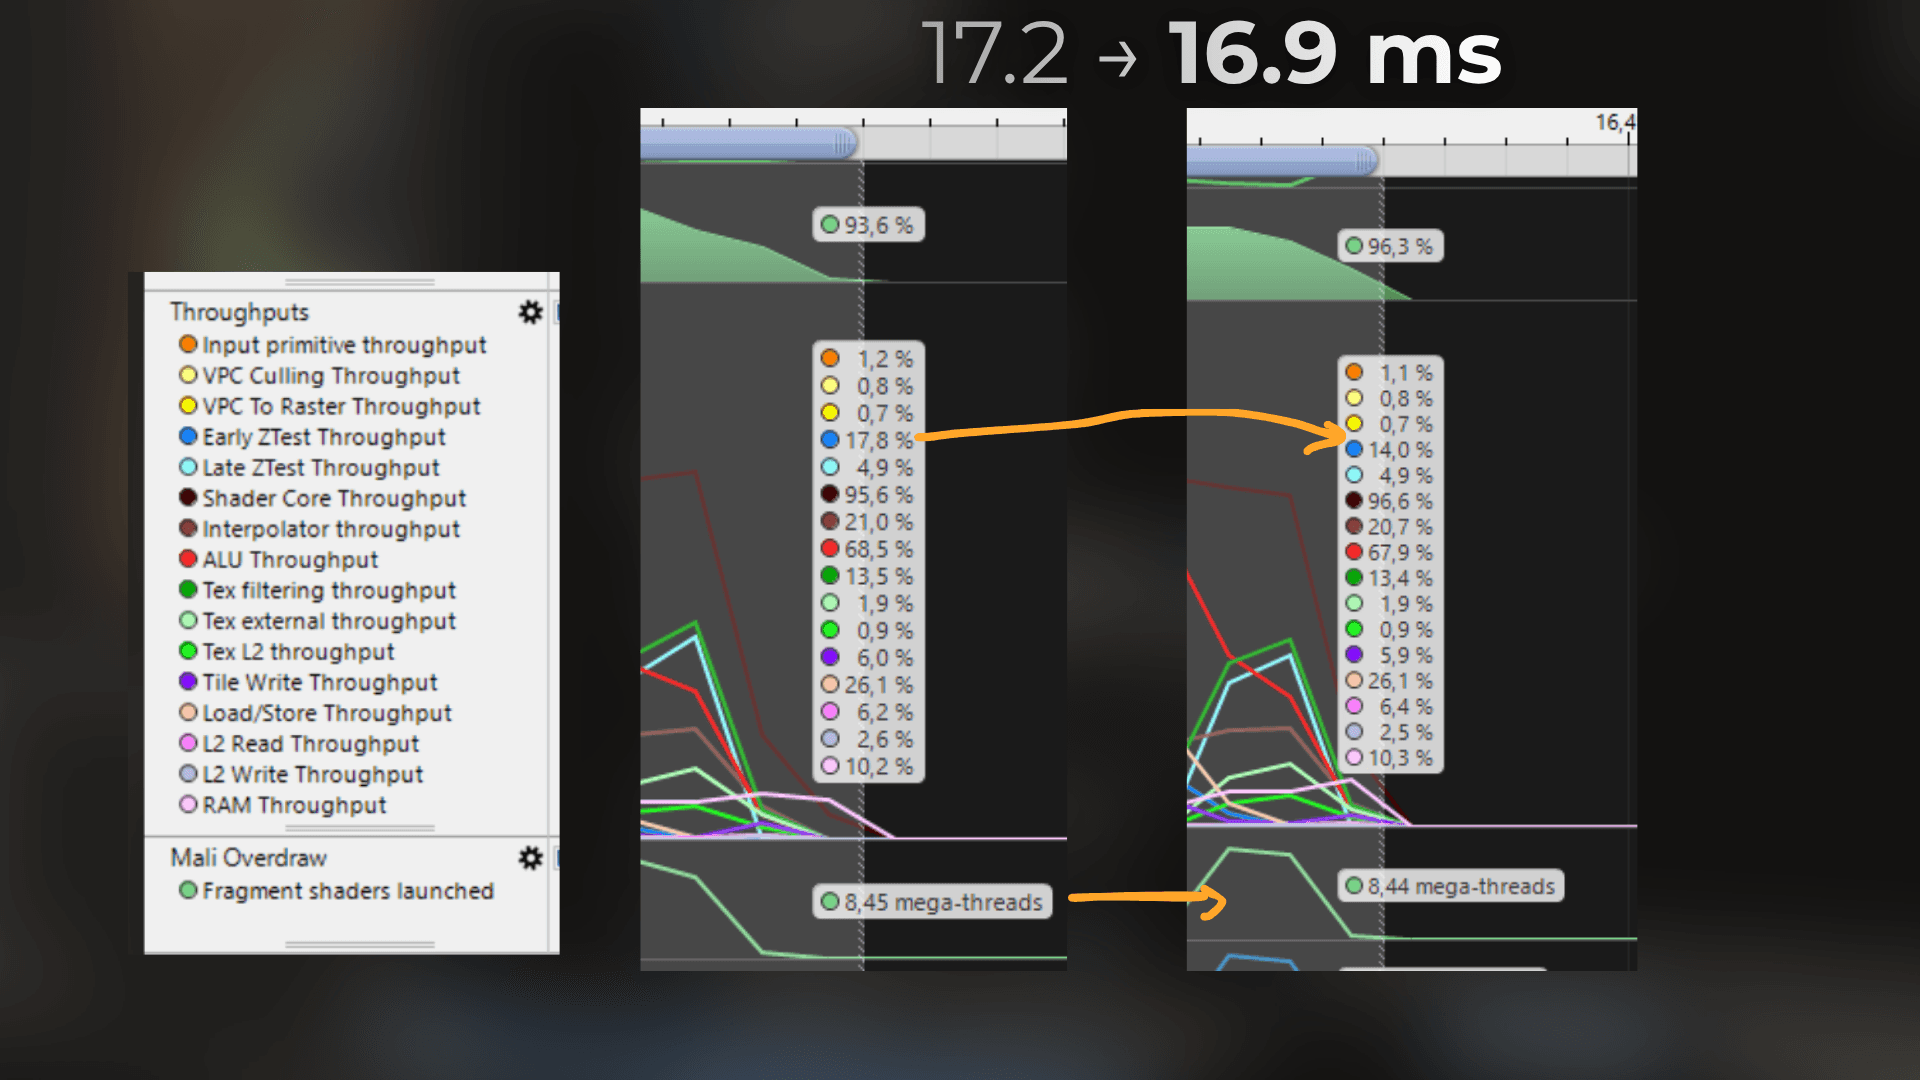
The GPU was already rejecting those hidden pixels before fragment shading. I spent time cutting triangles that were almost free to render.
____
How I think about the GPU pipeline
To explain this result, I need to show how I think about the GPU pipeline.
This is only my mental model. It is not an exact diagram of how the hardware is implemented. But when I reason about rendering in this way, I usually arrive at the correct optimization ideas.
For a single draw call, the work looks roughly like this:
Fetch vertices.
Execute the vertex shader to find where each vertex is on the screen.
Connect vertices into triangles, clip them against the screen, and cull backfaces.
Distribute triangles to the correct GPU units. On a mobile tiled GPU, triangles are assigned to the tiles they overlap.
Rasterize the triangles and perform depth testing.
If the pixel survives, execute fragment shading and color blending.
___
Early-Z
Imagine that I have already rendered the island and now want to render a water triangle behind it. Let's see what happens in this pipeline when I try to render triangles and pixels behind the island:
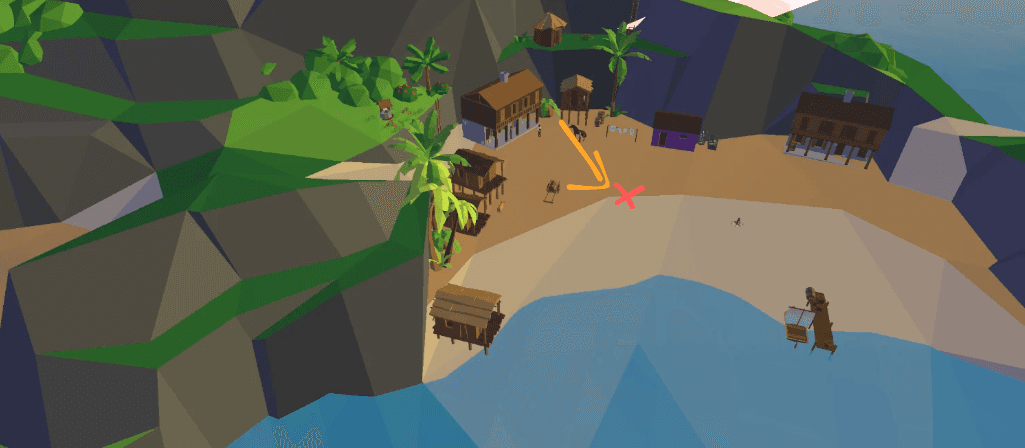
For the pixels covered by the island, the depth test can run before the fragment shader. This is called early-Z. The GPU rejects the pixel, so there are no texture reads, no fragment shading, and no color blending.
This is what happened to the water under the island. Its triangles still went through vertex processing, triangle setup, rasterization, and a cheap depth test. But then their covered fragments were rejected. The expensive fragment shader never started.
Visible water is different. The depth test passes, the fragment shader runs, textures are sampled, and the result is blended into the color target. This is where most of that 3.8 ms came from.
This is especially important on mobile. The device is not plugged into a wall, so it needs to be energy-efficient. Mobile GPUs are designed around tiling and rejecting unnecessary work as early as possible.
A depth buffer with a reasonable opaque rendering order can work like hardware occlusion culling for fragment shading, although the earlier geometry and rasterization stages still do work.
That is why deleting hidden triangles barely changed the frame time. I optimized geometry, but geometry was not my bottleneck. The expensive part was shading the pixels that survived early-Z.
___
Overdraw is per-pixel overhead
When people say "overdraw," they usually mean that something was drawn on top of something else.
Overdraw debug views usually count how many triangles overlap with the pixels and show a stronger color when this happens many times.
But when I talk about performance, what matters is the work performed per pixel:
fragment shading
texture reads
color blending
depth testing
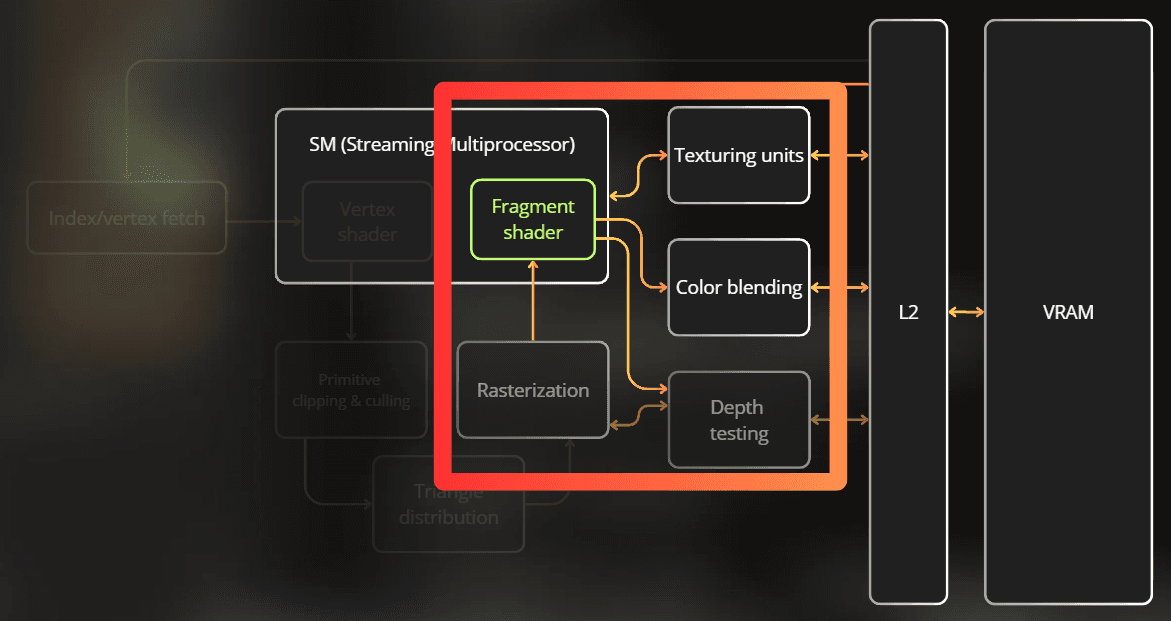
I treat overdraw primarily as a per-pixel performance problem, while still accounting for the vertex, triangle-setup, rasterization, and depth-test work that generates those pixels.
The cost per pixel is also not constant. It depends on:
whether you use a depth buffer at all
early-Z vs late-Z
render order
overall shader complexity:
how many textures you read
how many instructions you use and what they are
whether memory reads are cache-friendly
register pressure
blending: opaque write vs transparent read-modify-write
the formats of the color and depth targets
how many color targets you use
For example, transparency blending must read the existing color, mix it with the new color, and write the result back. This usually needs more memory operations than an opaque write.
Blending into an 8-bit target can also be much cheaper than blending into a 32-bit target etc.
___
Formats are important
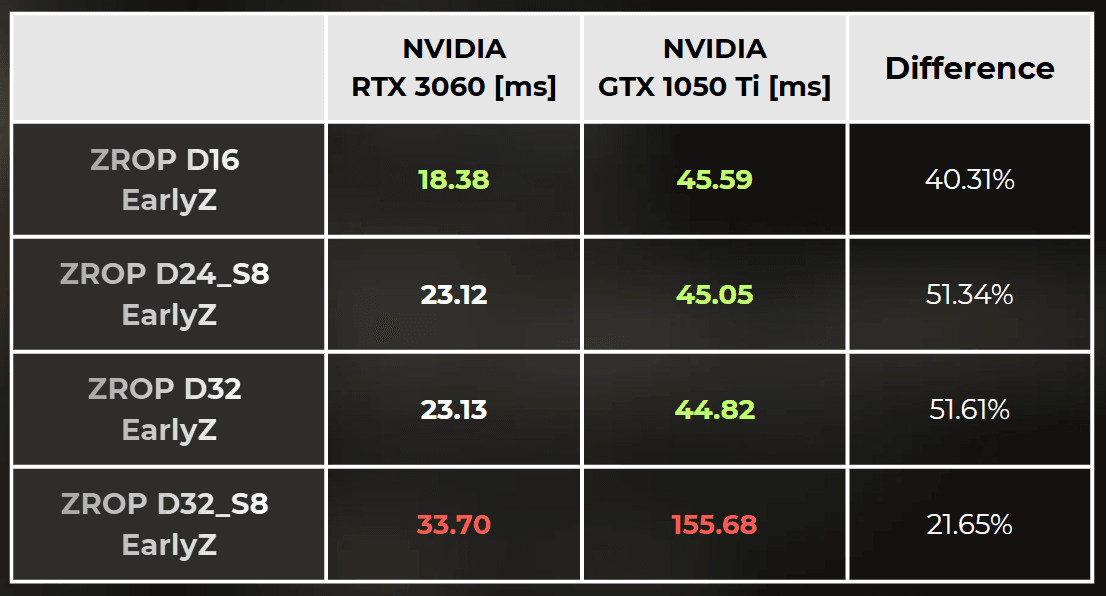
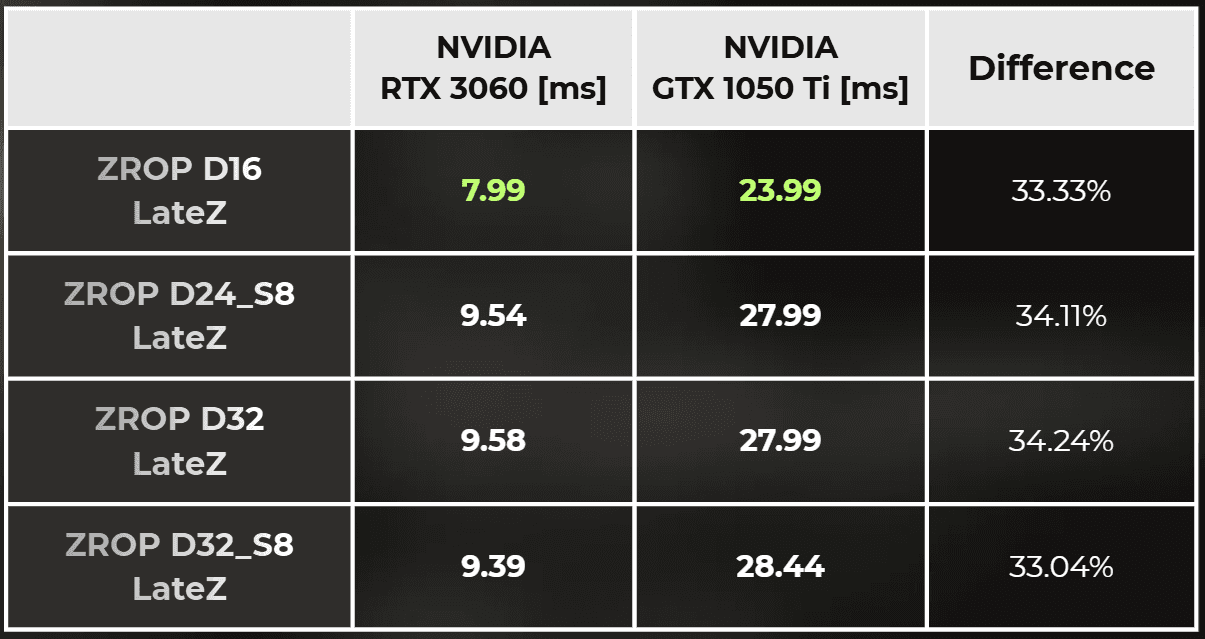
Lower-precision formats are faster. I did some benchmarks in the past, comparing the color blending and depth testing speeds between RTX 3060 and GTX 1050 Ti, by blending a lot of fullscreen triangles.
Depth (early-Z): You can see that depth tests at 16-bit and 24-bit precision are much faster than at full precision with a stencil buffer.
However, late-Z did not show such large differences in my tests.
For color blending, less data per channel again meant faster blending:
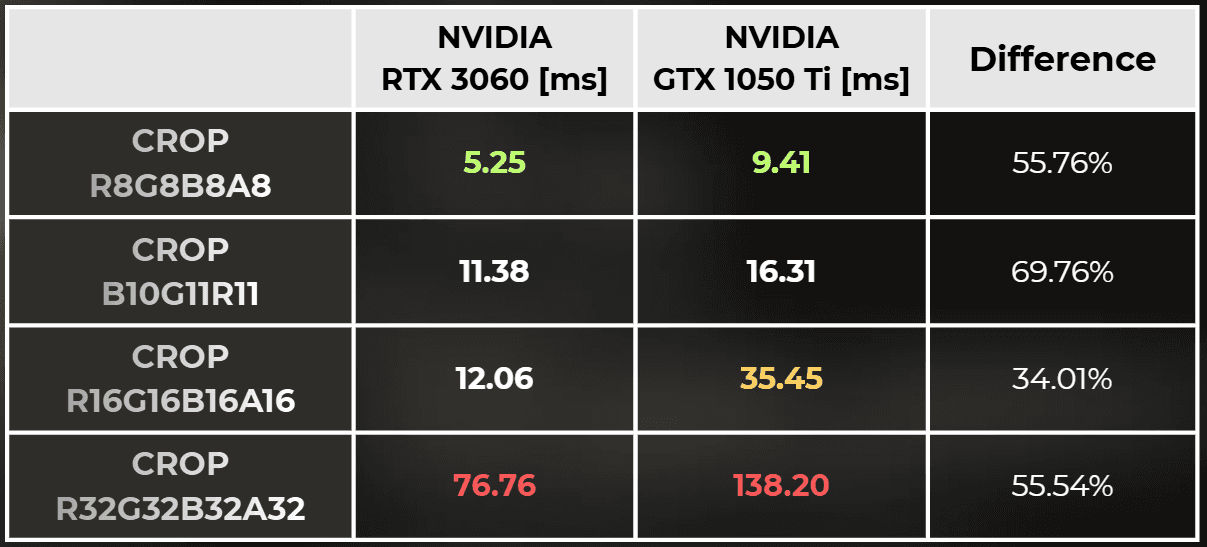
Full-float blending is about 6x slower than half-float blending, even though it contains only 2x more data.
So when I think about overdraw cost, I look at how many pixels execute the shader, what the shader does, and which target format it writes into.
___
discard kills early-Z
There is one more important thing to consider: the discard instruction or custom depth value modifications in the fragment shader.
We often use discard for vegetation cutouts, see-through walls, holes in an opaque surface, or dithered transparency. The decision happens inside the fragment shader, so the GPU may not know the triangle's depth in advance or whether it will write depth.
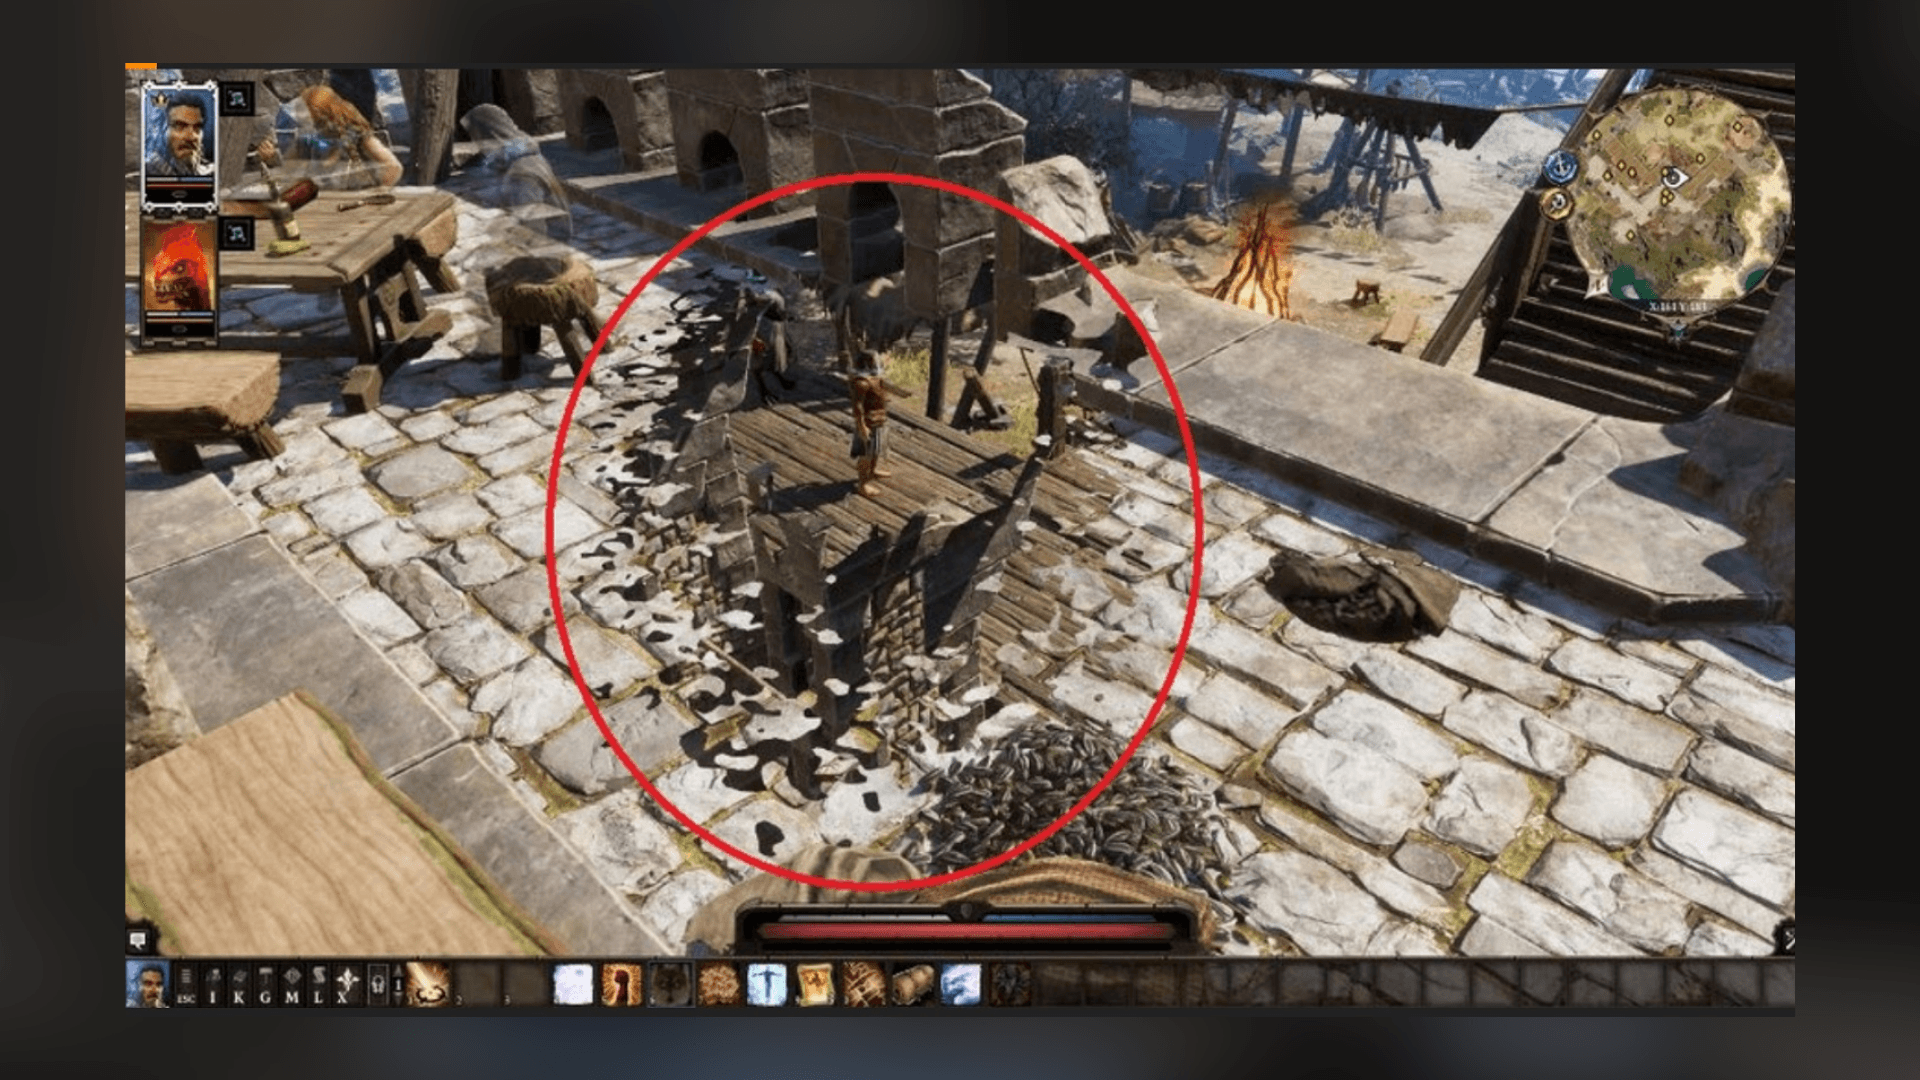
In the simple pipeline model from the previous section, this can prevent the GPU from rejecting all hidden pixels before fragment shading. The work now looks like this:
Rasterize.
Execute the fragment shader and evaluate
discard.Perform the depth test later.
Blend the color if the pixel survives.
The exact behavior depends on the GPU and shader, but discard usually disables the early-Z optimization that made my hidden water so cheap. When this happens, every overlapping pixel pays for fragment shading.
This is what the pipeline looks like with the discard instruction enabled.
___
Discard instruction experiment
To test it, I added the following code to every shader in the game. Almost no pixels are actually discarded by this condition:
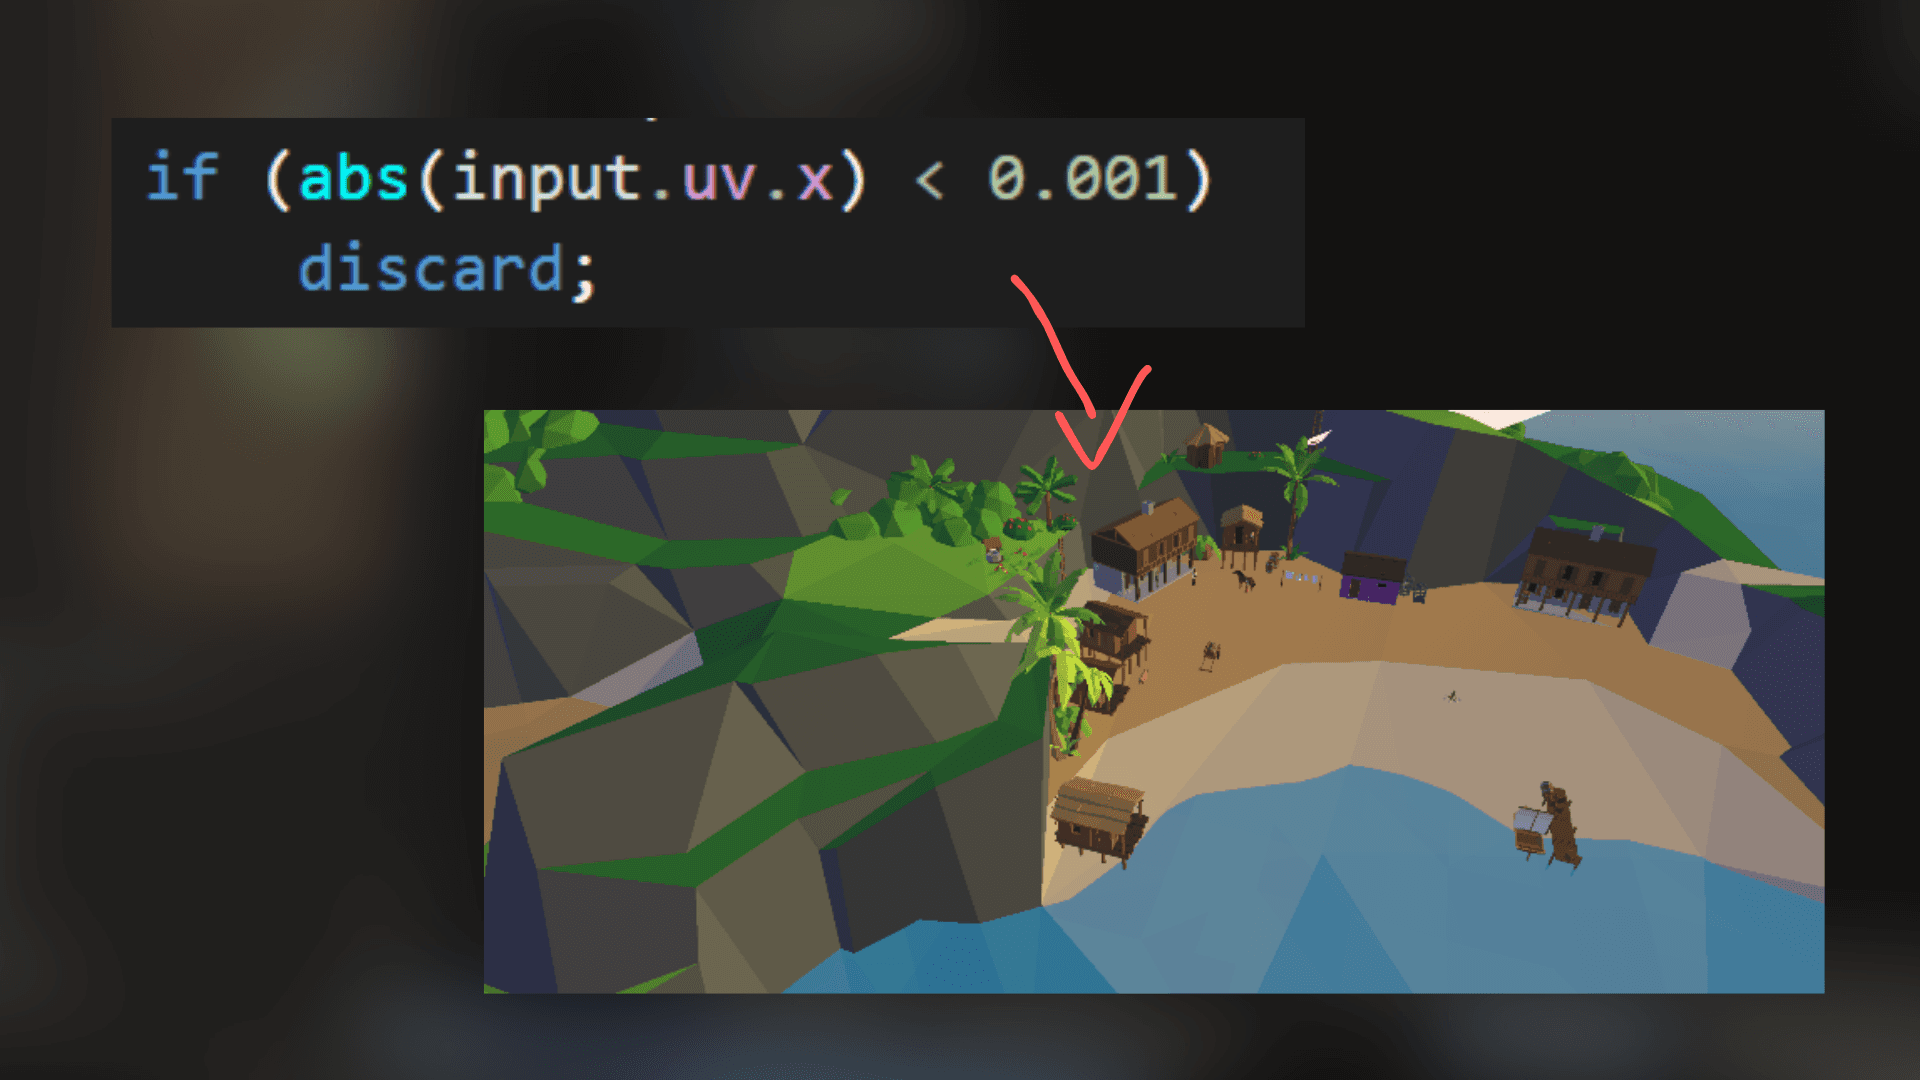
The result was painful: 17.2 ms increased to 35 ms. Same scene, same camera, and the same triangles.
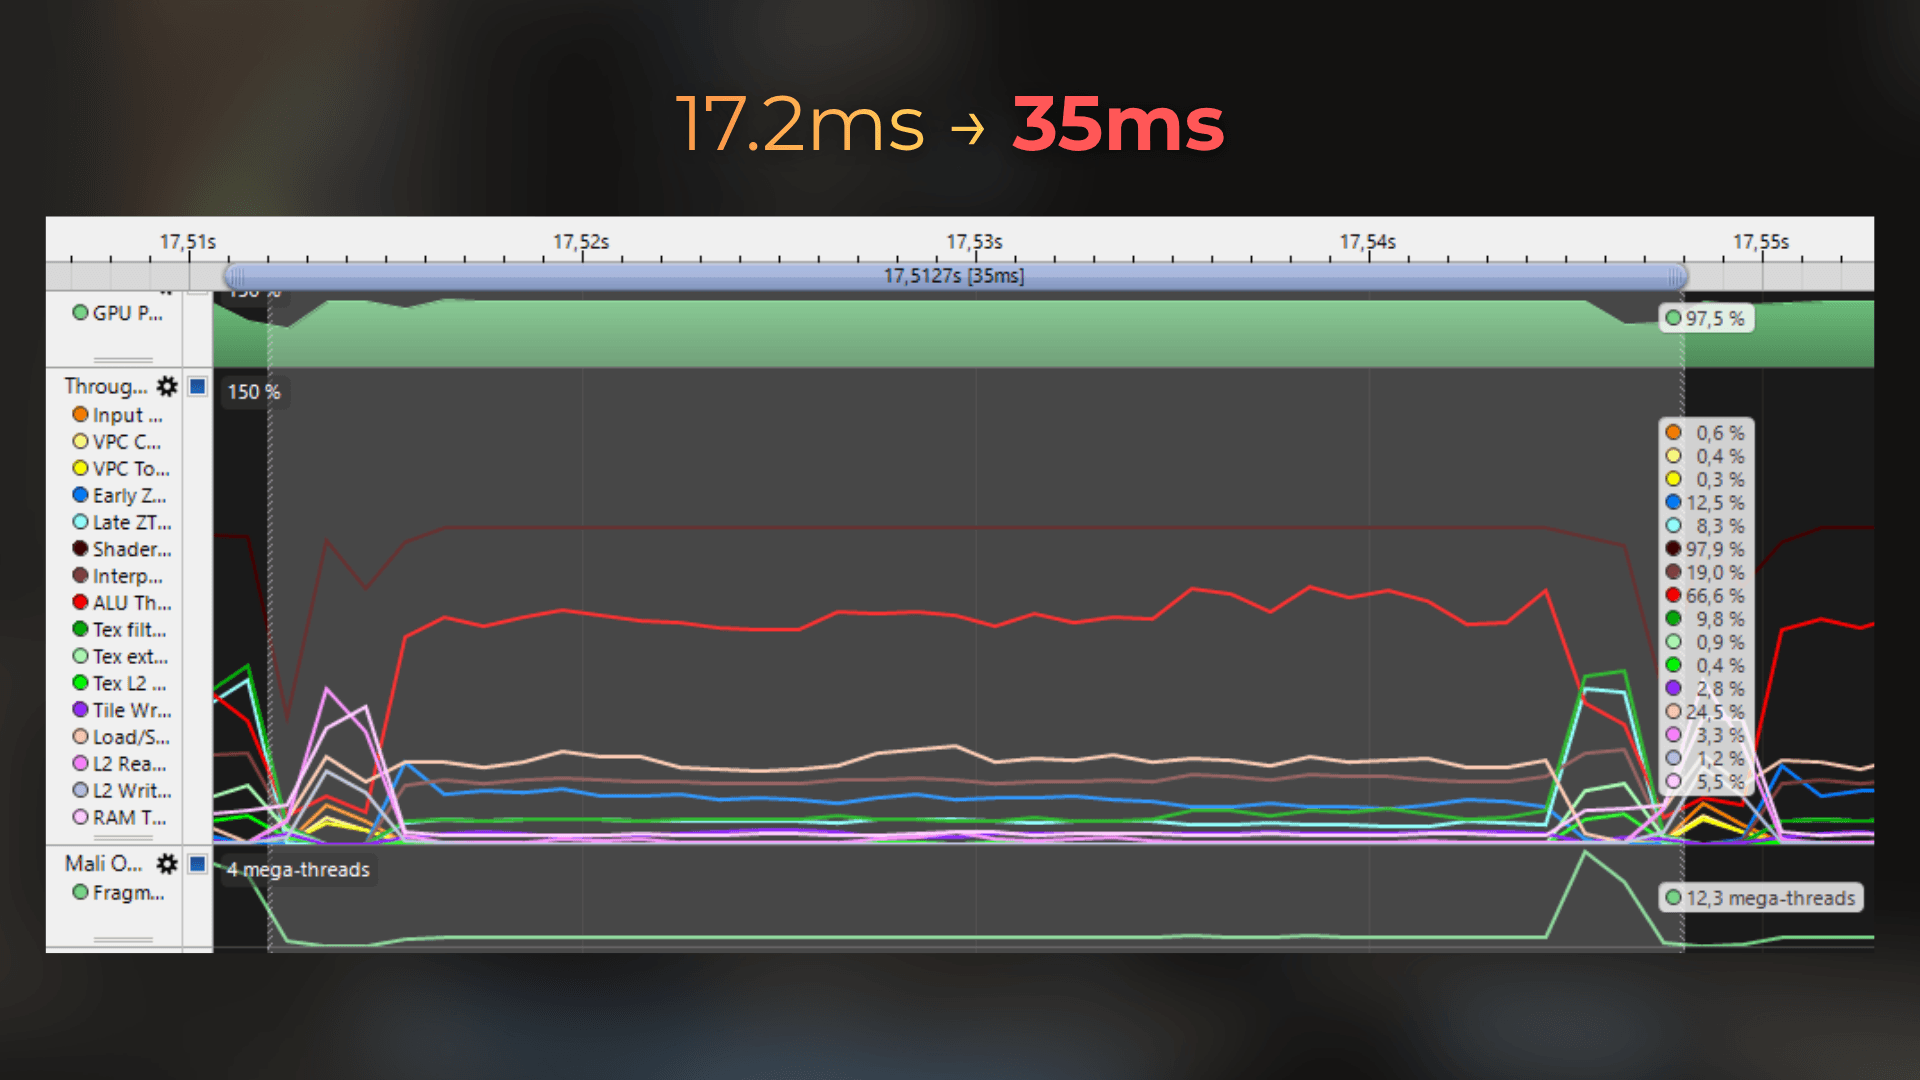
Late-Z throughput increased, and the frame time doubled. The GPU also launched about 4 million more fragment shaders:
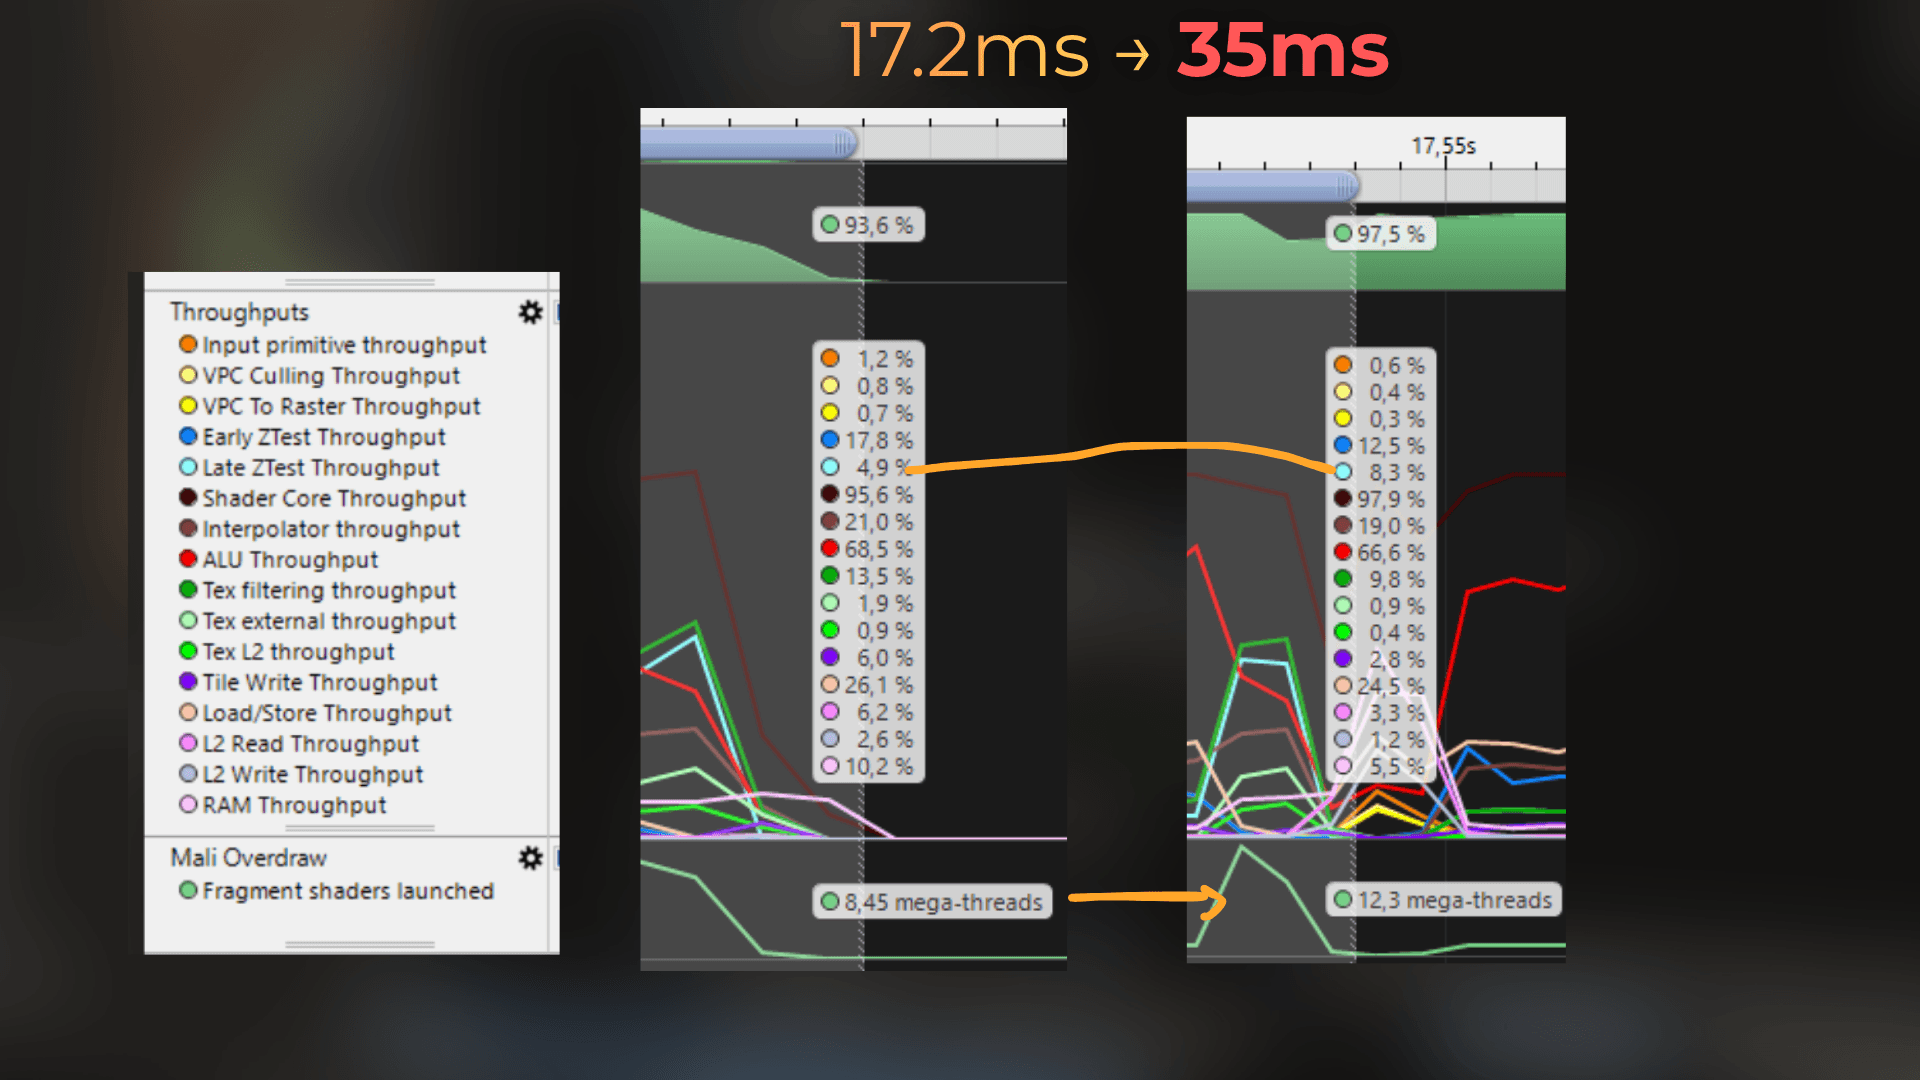
Those extra fragment shaders come from the hidden water and terrain, plus other pixels that early-Z rejected before. Now they execute the fragment shader.
This is a case where opaque overdraw really matters. If the shader uses discard or changes depth in a way that prevents early testing, the GPU may need to shade pixels that will be rejected later. Then the number of times you draw the same pixel becomes a real cost.
If I need discard, I keep it only in the materials that actually need it. For effects such as holes around the player, I also try to limit it to objects close to the camera. I definitely do not add it to every shader "just in case".
___
Triangle culling with discard
Now I repeated the triangle-culling test, but this time with discard enabled in the shaders.
Previously, removing the triangles under the island improved the frame by only 0.3 ms. Early-Z was already rejecting their pixels, so there was almost nothing to gain.
With the discard instruction in all shaders, the same optimization produced a completely different result:
35 ms dropped down to 27 ms.
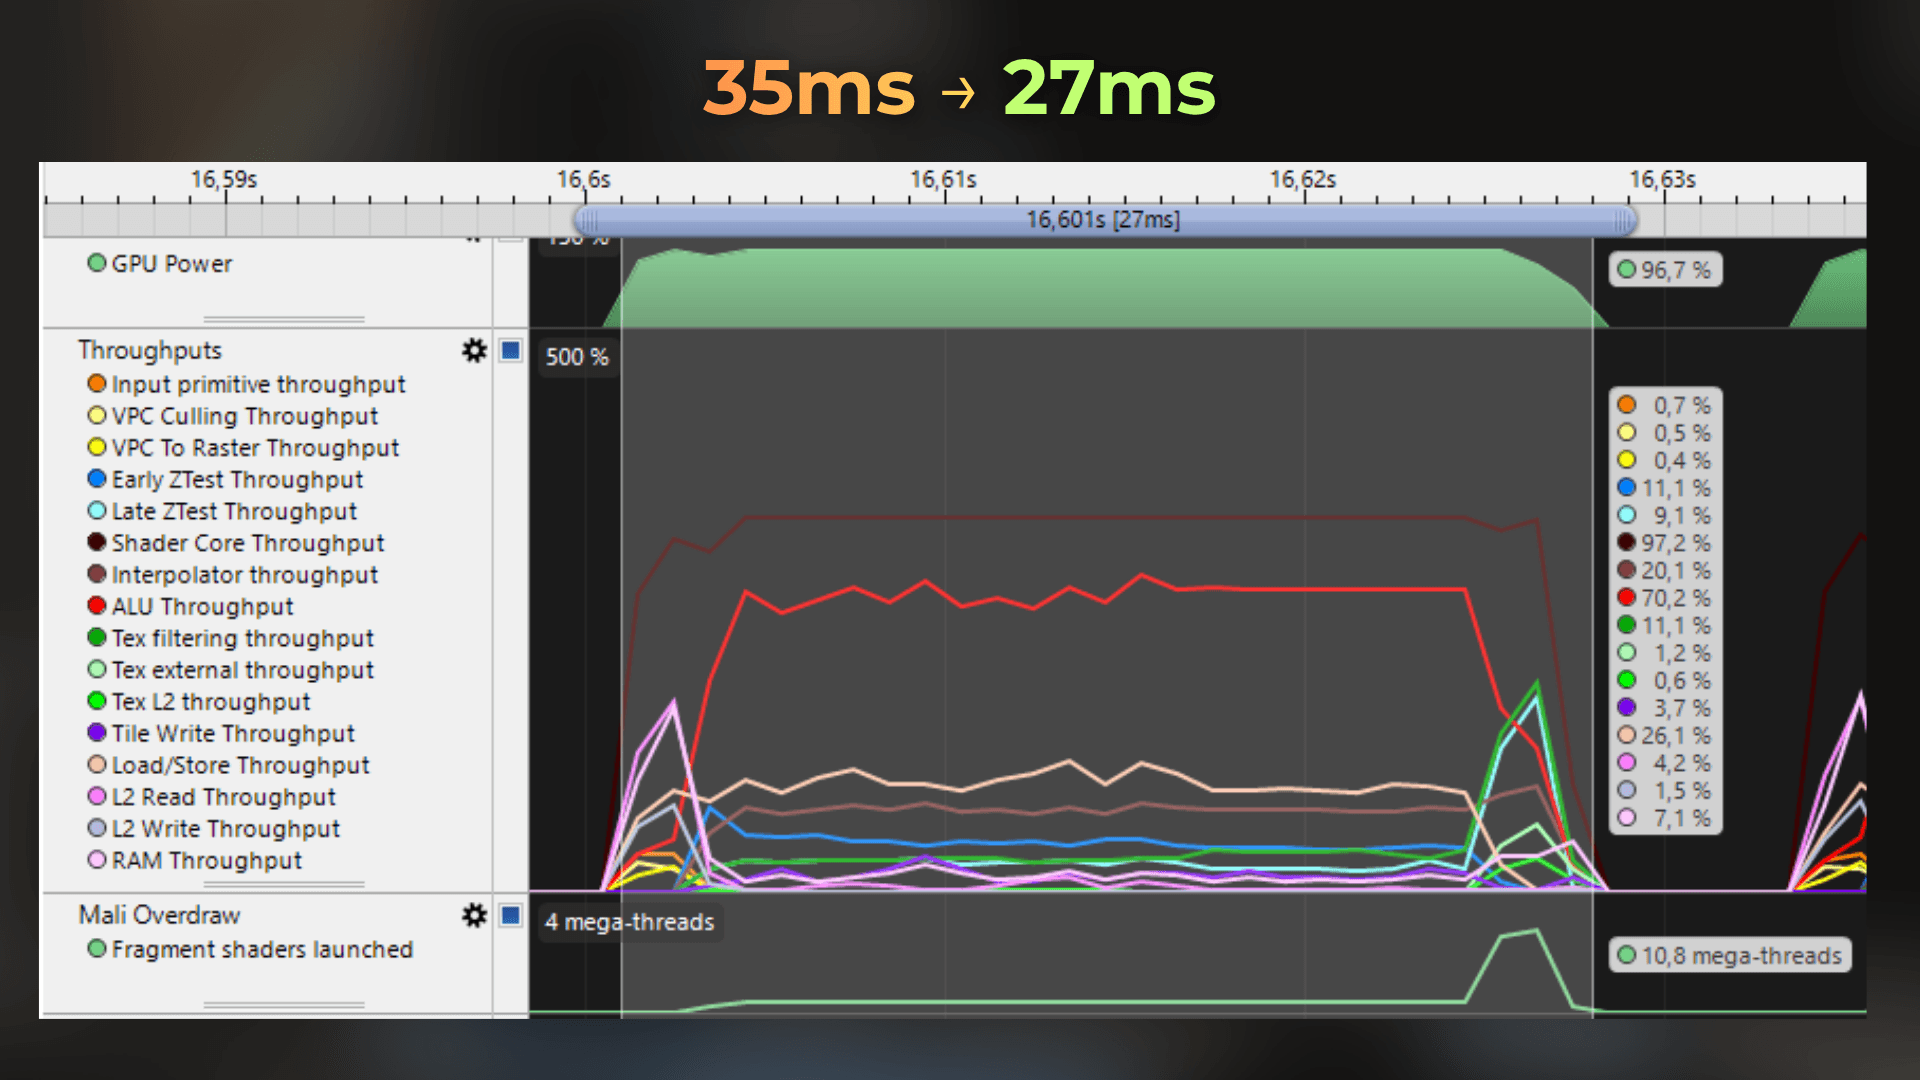
That is an 8 ms improvement from removing the hidden triangles. Because discard prevented the GPU from using the same early-Z path, the hidden water and terrain executed fragment shaders before failing the depth test. Removing their triangles now removed real shader work.
The frame was still much slower than the original 17.2 ms version without discard. Triangle culling recovered part of the lost performance, but it did not fix the main problem caused by adding discard to every shader.
This is why an overdraw debug views alone cannot tell me how expensive the overdraw is.
___
Comparison of the opaque-scene tests
Test | GPU frame time | Change from baseline | What the comparison shows |
|---|---|---|---|
Original scene | 17.2 ms | — | Baseline with working early-Z |
Water and water bed deleted | 13.4 ms | -3.8 ms | Removes visible shading as well as hidden geometry |
Hidden triangles culled | 16.9 ms | -0.3 ms | Hidden fragments were already rejected before shading |
| 35 ms | +17.8 ms | Loss of the effective early-Z path exposes hidden fragment cost |
| 27 ms | +9.8 ms | Culling recovers 8 ms, but remains much slower than baseline |
___
What I actually optimize
For opaque rendering with a depth buffer, this is what I usually focus on:
Consider rendering useful occluders early: objects with a large screen-space area, a cheap shader, and geometry close to the camera. In this scene, rendering the island before the water bed fills the depth buffer, so later hidden pixels can be rejected by the GPU.
Remove
discardand custom shader depth writes when the effect does not need them.Do not spend a week removing triangles that already fail the depth test unless profiling shows that vertex or geometry processing is the bottleneck.
Hidden geometry under an island can look bad in an overdraw view, but it may cost only a cheap early depth test.
For pixels that do execute the fragment shader, I focus on the real per-pixel cost: texture reads, shader instructions, target formats, blending, and late-Z versus early-Z.
An overdraw debug view often cannot tell these cases apart. I still need to understand the rendering.
So my rule is simple: profile the frame first, measure the milliseconds, establish the real bottleneck, and only then decide whether the orange pixels matter.
___
Overdraw in transparency, VFX, 2D games, and UI
Everything above focused mostly on opaque rendering. Transparency is a different case.
Transparent objects usually test against the opaque depth buffer, but they often do not write depth themselves. They also almost always need color blending. This means that one transparent sprite usually cannot hide another in the same way the island hid the water.
This is common in:
particle effects and VFX
2D games built from many overlapping sprites
UI elements
If ten transparent particles overlap the same pixel, the GPU may execute ten fragment shaders, read their textures, and blend ten results. Here, overdraw can become expensive very quickly.
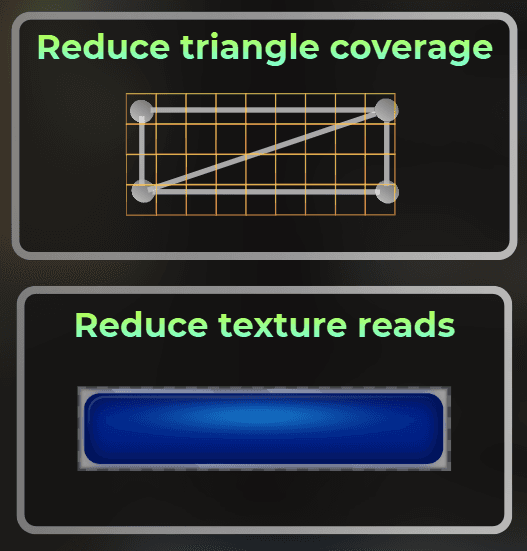
For transparent rendering, I usually have two main optimization levers:
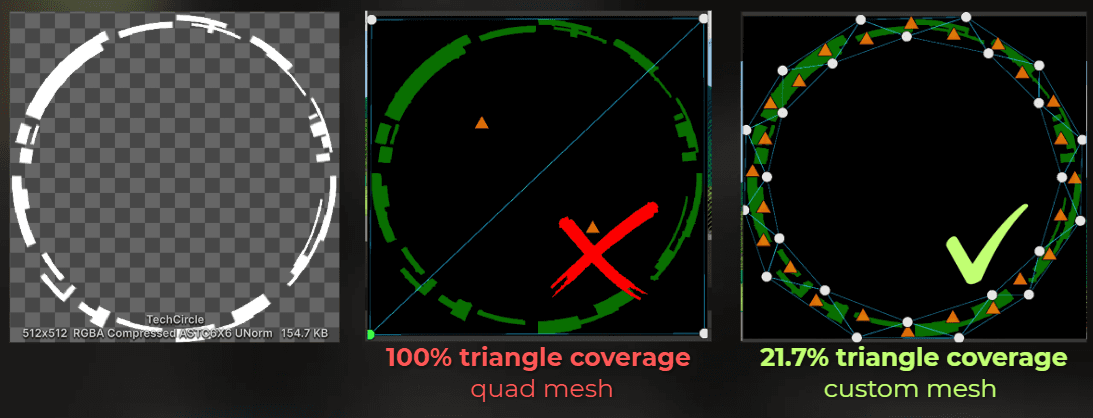
Reduce triangle coverage, so fewer pixels execute fragment shaders.
Reduce texture reads and other work inside the fragment shader.
UI profiling example
I tested this on the same Redmi 12. The UI has five buttons placed over a transparent background.

Each button is built from five visual layers: a background, background light, blue rectangle, blue light, and text. Unity can batch some of this work, so the full UI uses six draw calls, but all those layers still overlap on the screen.
The original version takes 7.2 ms on the GPU. Most of the time is spent on rasterization and texture reads. In these Streamline captures, I call rasterization a bottleneck when interpolator throughput and Early-Z throughput are the saturated or limiting counters; those are the profiler signals supporting that conclusion here.
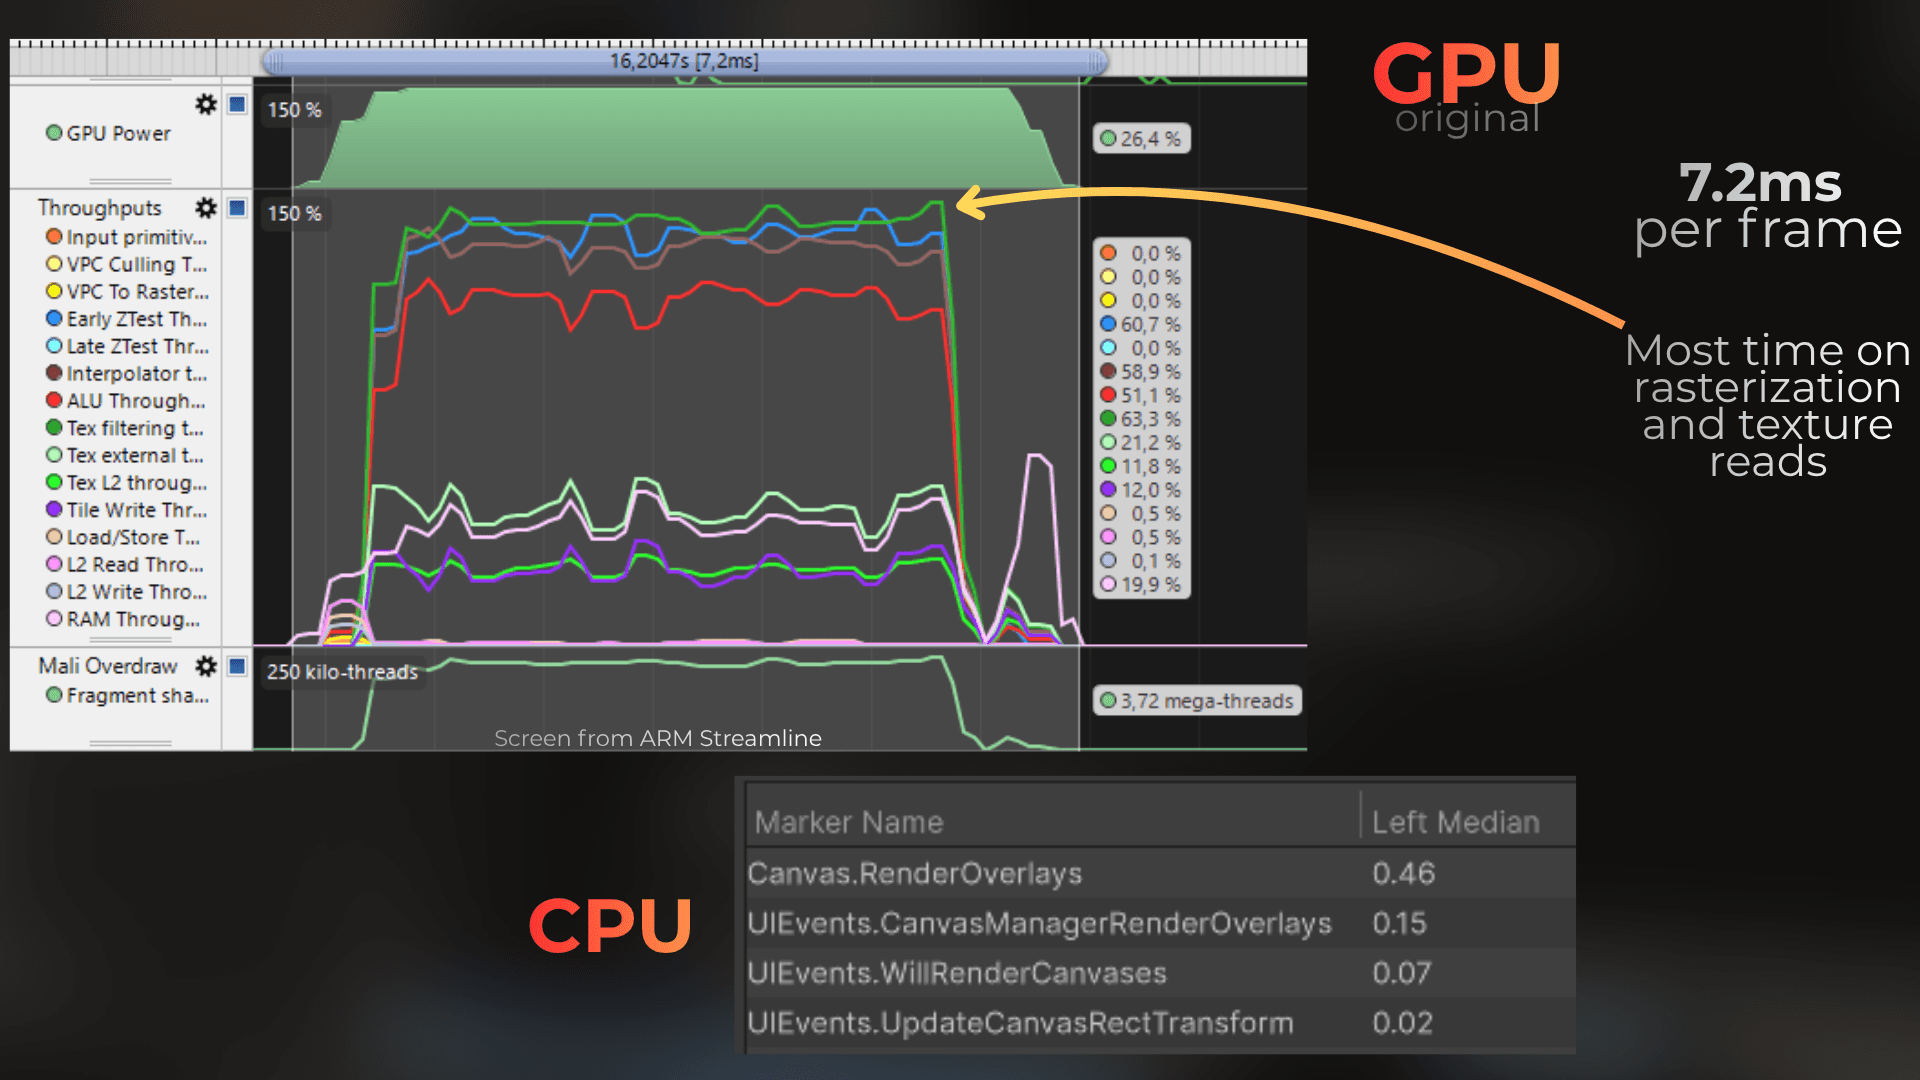
The GPU is not even running at full power here. Android lowered its clocks because the workload is small, but the UI still takes a large part of the frame. This is why simple-looking mobile UI can sometimes be surprisingly expensive.
Optimization 1: Sprite atlas
The most common UI optimization advice is to put sprites into an atlas. This lets neighboring UI elements use the same texture and makes batching easier.
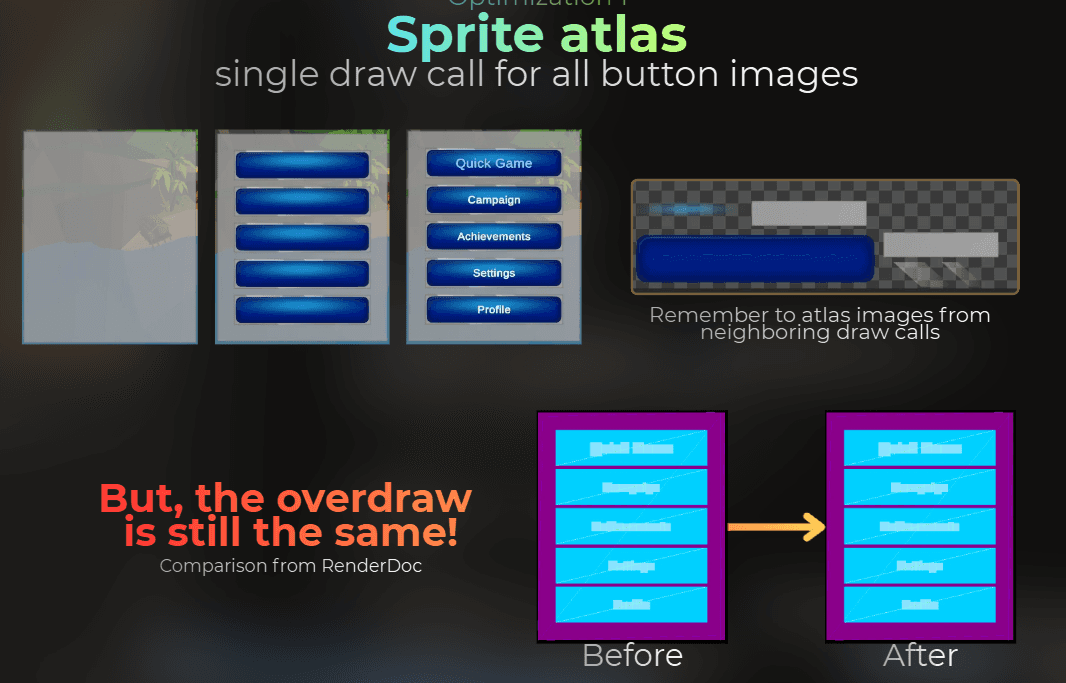
After adding the atlas, frame time dropped from 7.2 ms to 6.8 ms.
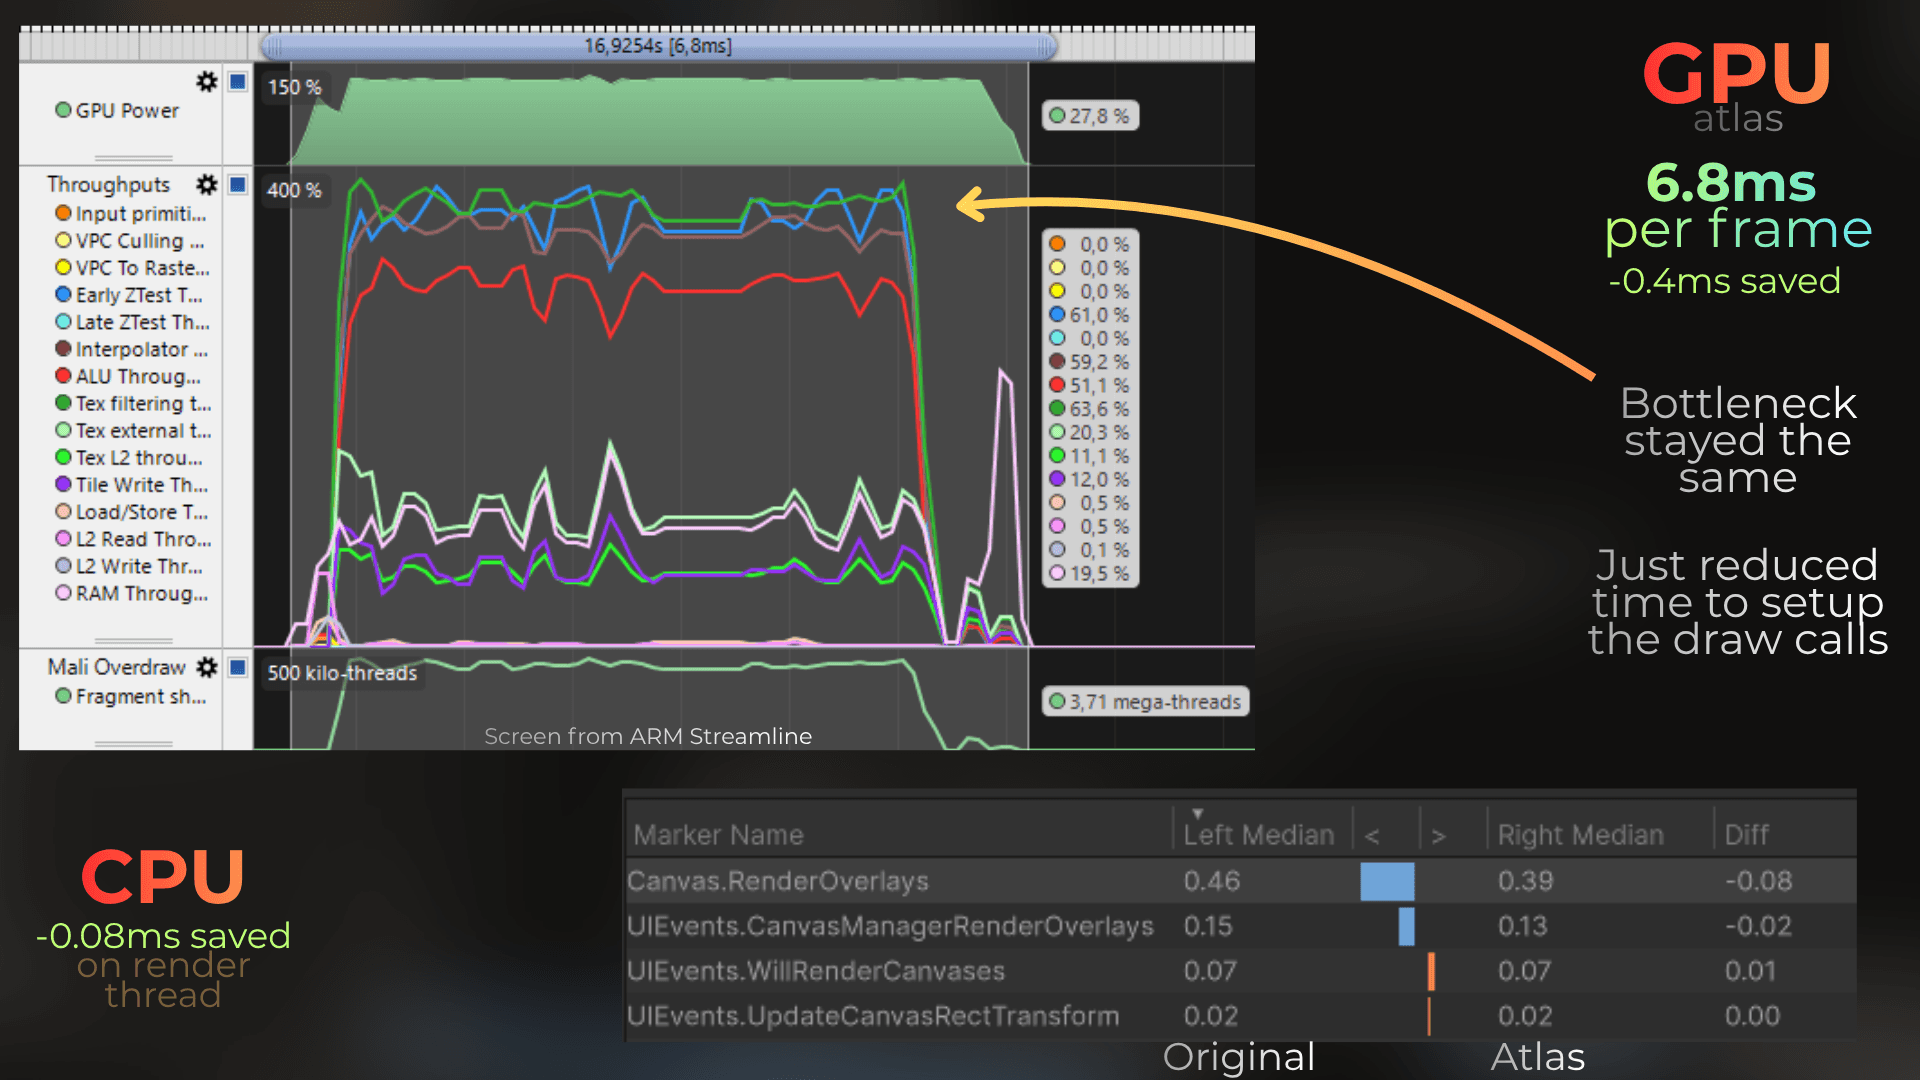
The draw-call count dropped from six to two, while frame time dropped by 0.4 ms. The GPU bottleneck stayed the same, and the atlas did not remove any button layers, fragment shaders, or blending operations.
An atlas helps with batching. It does not fix overdraw by itself.
Optimization 2: Composite layers inside one shader
The next option is to draw one quad per button and composite the four image layers - background, background light, blue rectangle, and blue light - inside a custom shader. The fifth visual layer, text, remains a separate UI element and draw.
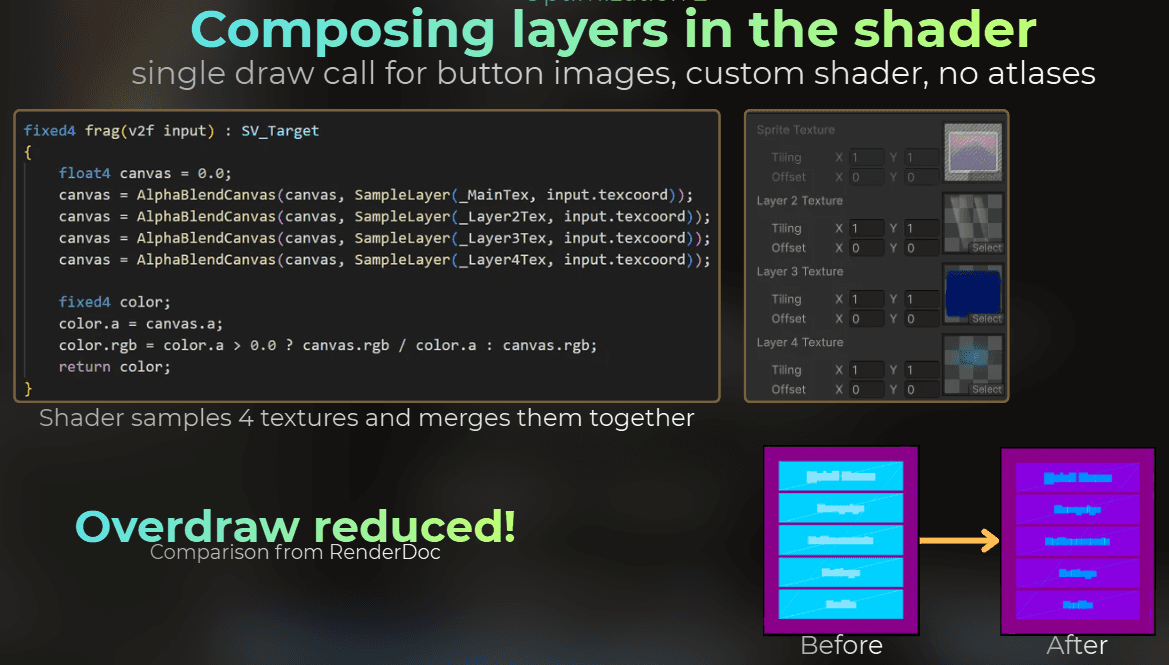
The shader reads four textures, combines them into one color, and blends the final result into the render target once. This reduces triangle coverage and color blending, but each fragment shader now performs four texture reads.
Frame time dropped from 7.2 ms to 6.2 ms.
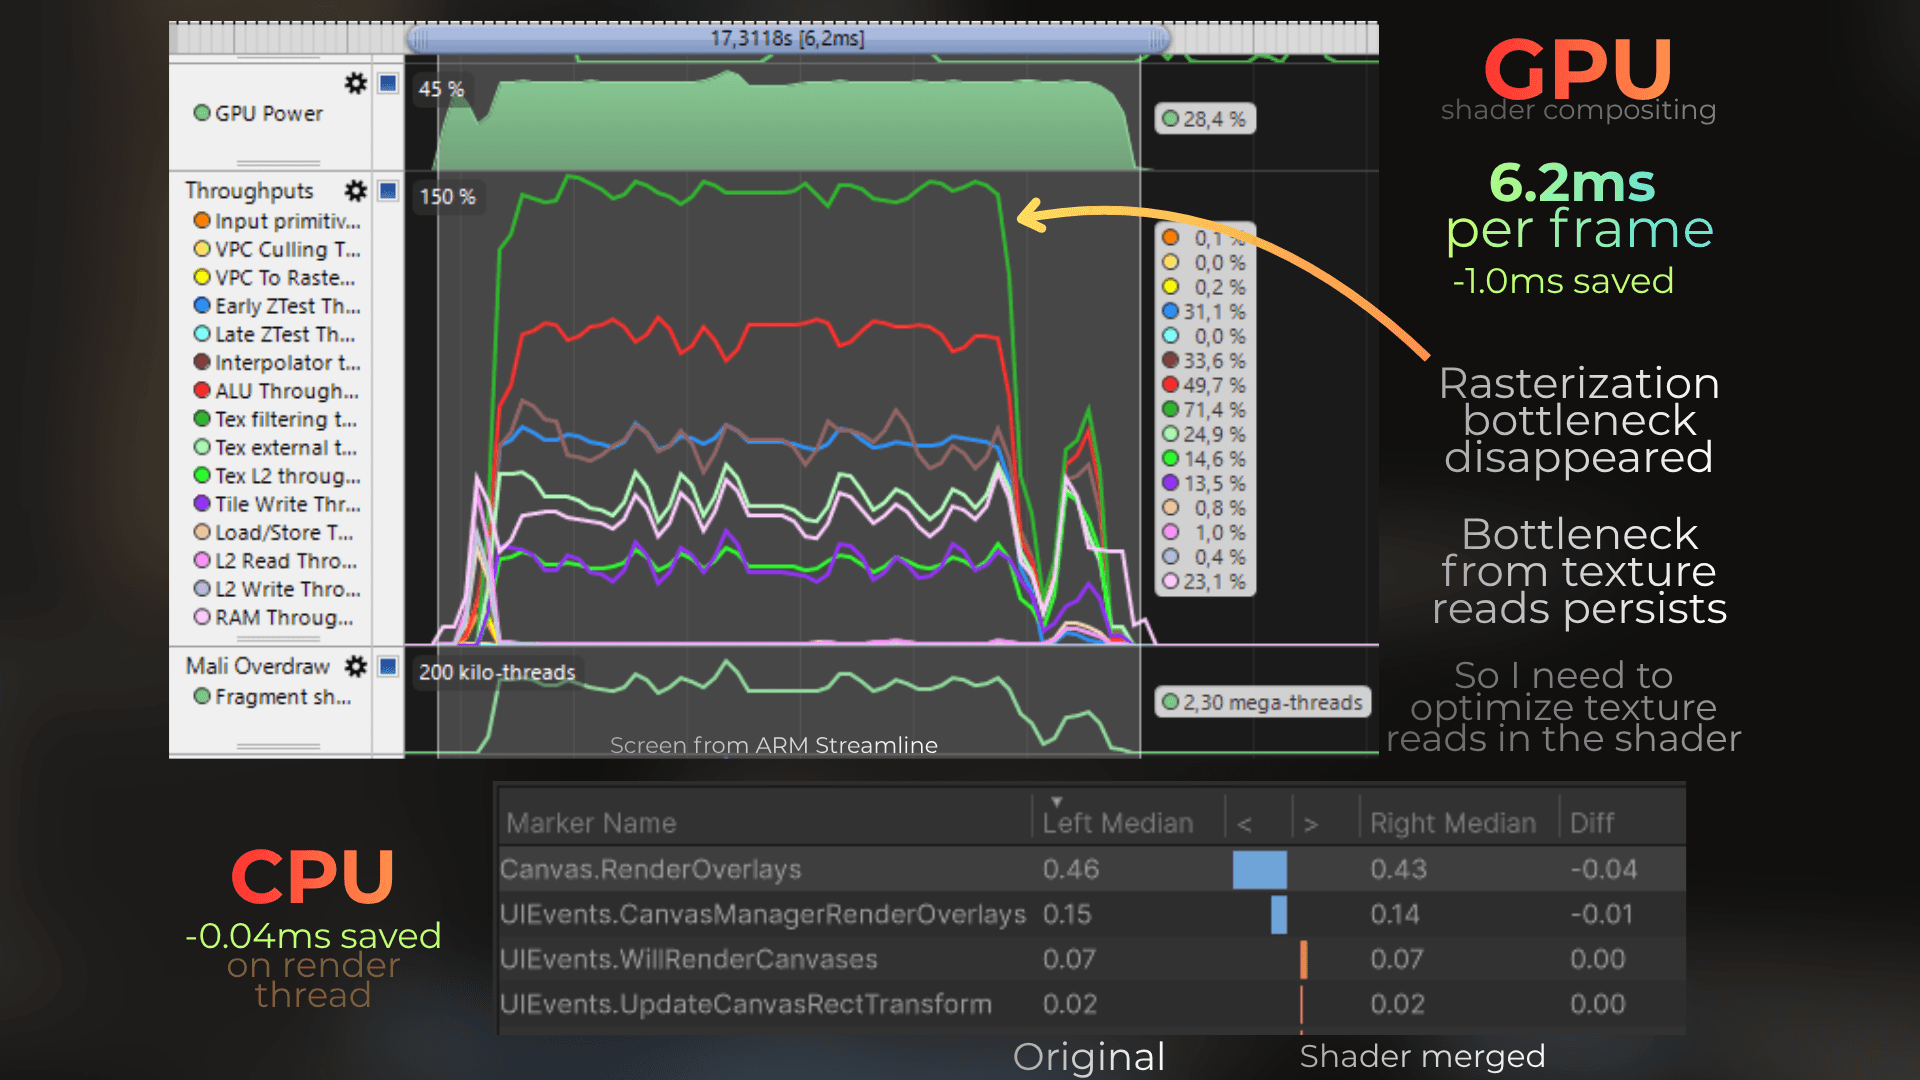
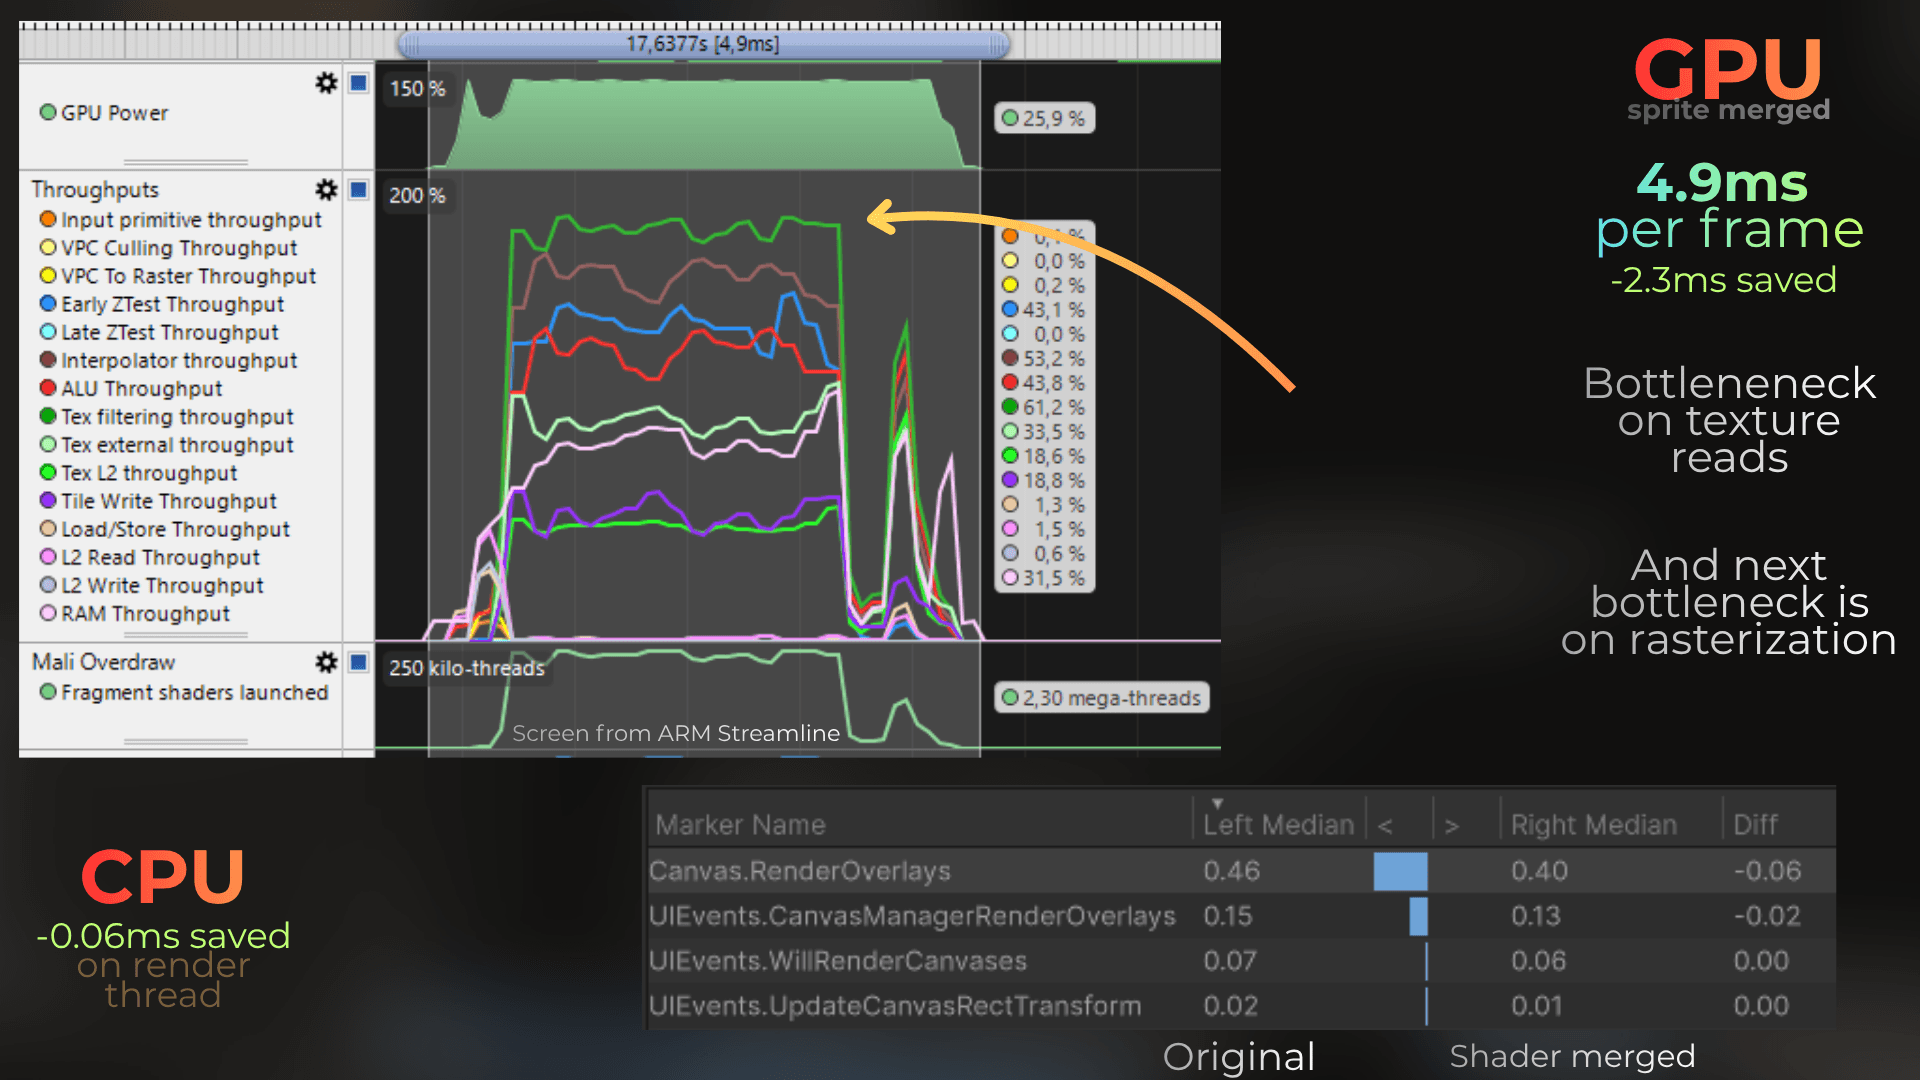
After this change, interpolator throughput and Early-Z throughput were no longer the limiting counters, which is what I mean by removing the rasterization bottleneck. Texture reads stayed expensive. I improved the frame by 1 ms and moved the bottleneck elsewhere.
Optimization 3: Merge the layers in the asset
The best version was also the simplest one. Instead of compositing the button from multiple layers at runtime, I merged those layers into one image.
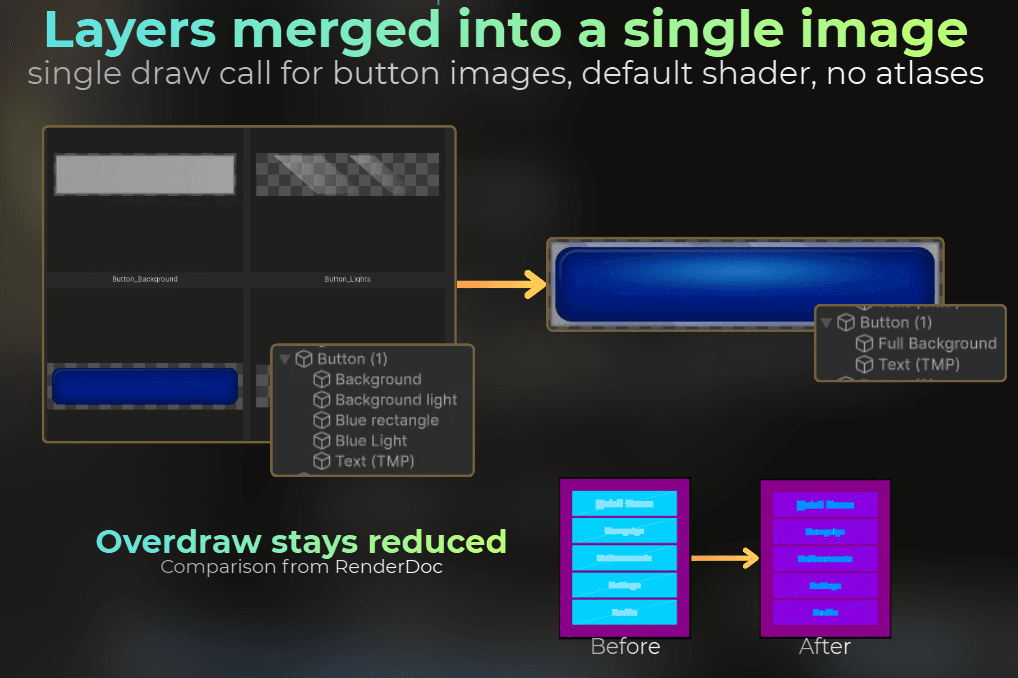
Now each button needs one quad, one texture read, and one blending operation. Frame time dropped from 7.2 ms to 4.9 ms, saving 2.3 ms.
This does not work for every UI. Sometimes layers need to animate independently, change color, or use different masks. But when an element is visually static, compositing it every frame is wasted GPU work.
What this means for VFX and 2D sprites
The same rules apply to particle effects and sprite-based 2D games.
For VFX:
avoid huge transparent quads with only a small visible shape in the middle
use tighter particle meshes when the reduced coverage is worth the extra vertices
reduce layers of smoke, fog, and additive lights that cover the same pixels
reduce texture reads and shader work when many particles overlap
use lower-resolution render targets for effects that do not need full resolution
For 2D games:
watch large full-screen sprite layers and foreground elements
merge static layers when they never move independently
do not assume batching removed the pixel cost
use opaque rendering and depth when an asset does not actually need transparency
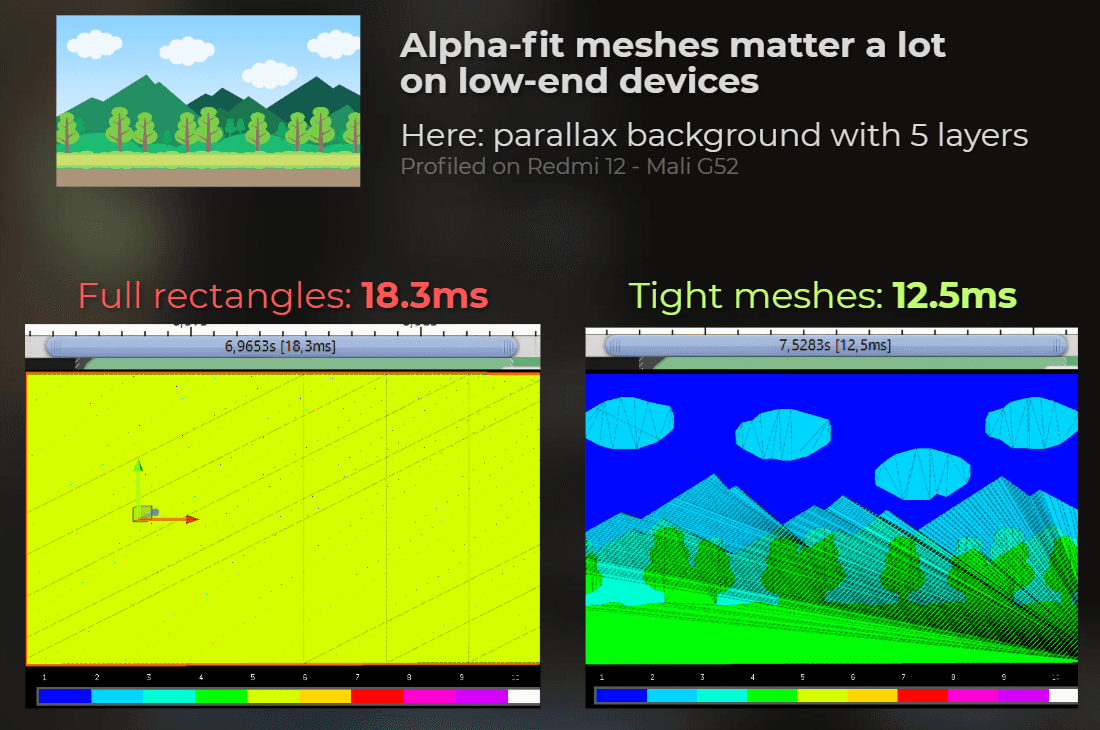
Again, the profiler decides which one matters. A particle effect can be limited by fragment shading, texture bandwidth, blending, triangle setup, or draw calls. The overdraw view shows only one part of that story.
Using depth in a 2D game or UI
There is also a more unusual optimization: use a depth buffer to reject fully covered sprites or UI elements.
Even if the game looks flat, its layers can have different depth values. Large opaque foreground shapes can write depth first. When the game later draws sprites behind them, the GPU rejects the covered pixels before fragment shading.
Imagine a 2D scene with large opaque foreground objects:

Those foreground shapes can be rendered into depth first. The gray areas below show pixels where background sprites could be rejected:
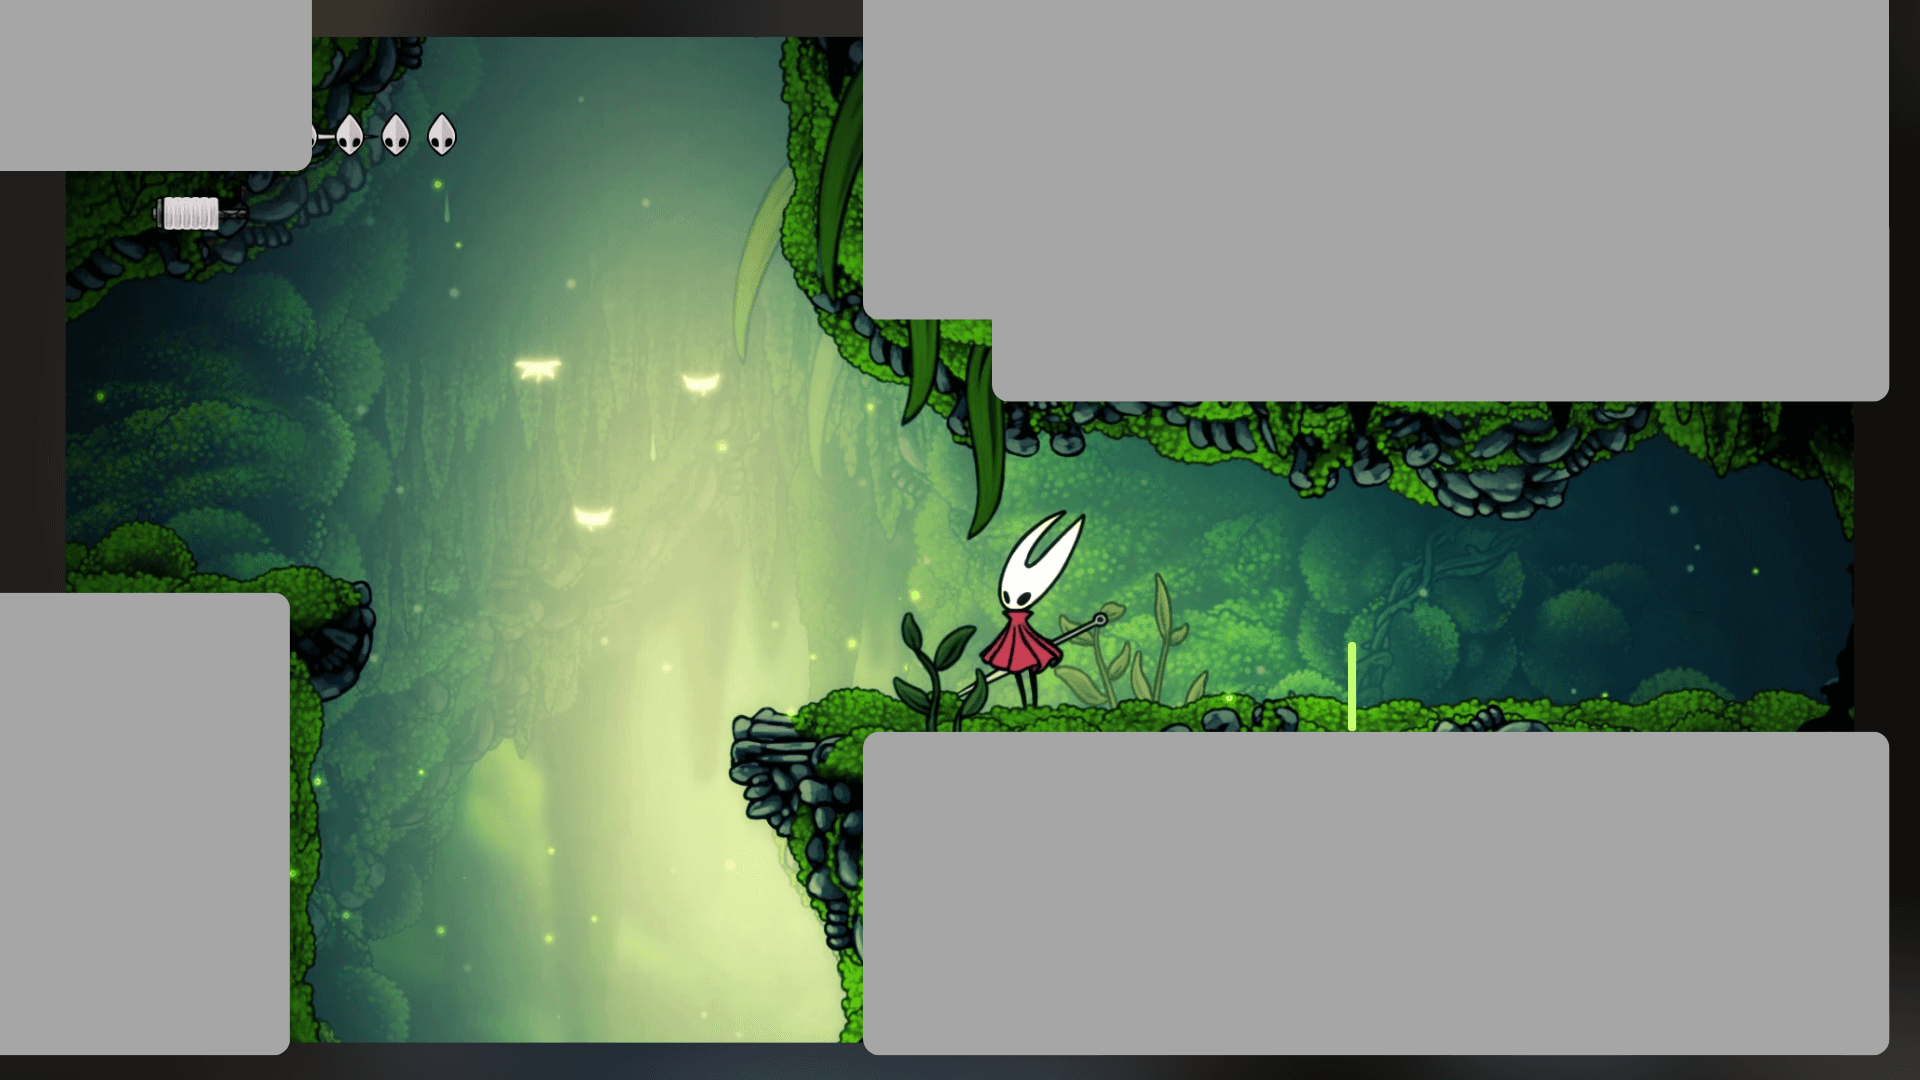
I used this approach in one 2D game with large opaque quads. They rendered depth before the expensive sprite layers, giving me hardware occlusion culling in a game that visually looked flat.
This optimization needs careful render ordering and correct separation between opaque and transparent elements. It is not something I would add without profiling. But on mobile or low-end hardware, it can save a lot of fragment shading in scenes with large covered areas.
Transparency summary
For opaque rendering, the fragment-shading cost of hidden pixels can be almost eliminated when early-Z rejects them, although geometry, rasterization, and depth testing still cost something. For transparency, VFX, sprites, and UI, overlapping pixels are much more likely to execute the full fragment shader and blend into the target.
So I focus on:
how many pixels the triangles cover, using tighter meshes
how many textures each pixel reads
how many times the result is blended
how many draw calls prepare the work
whether a depth buffer can reject anything early
By the way, I have a community with weekly meetings where we discuss rendering and optimization. Really cool stuff. Join now for free before I become greedy XD.