Beginner
Profiling
Optimization
Deep dive
How to properly profile your game
15 min
Best profiling workflow
How do you profile a game when performance is so sensitive?
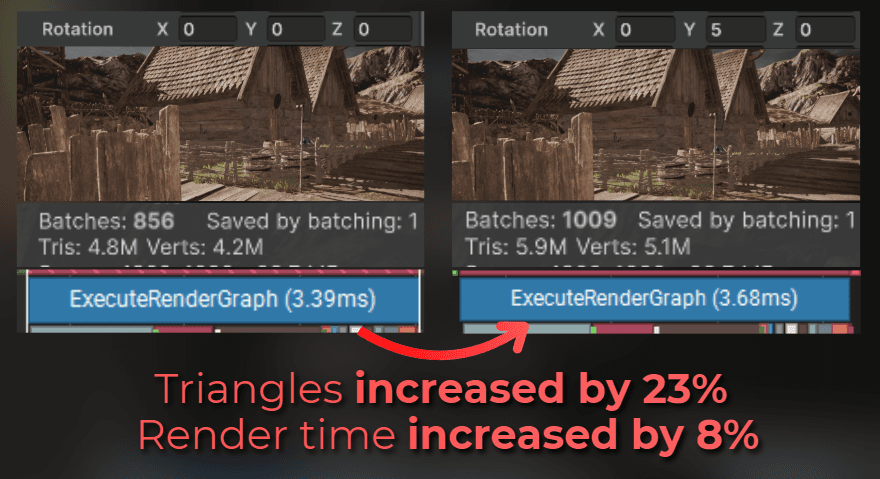
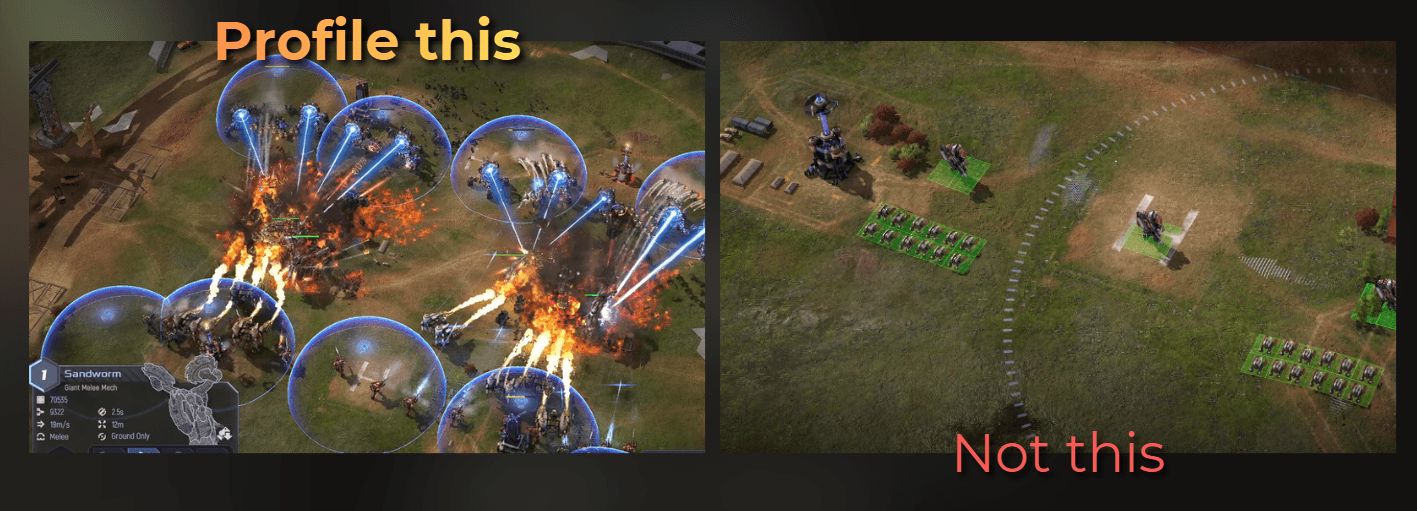
Look at this example. I changed the camera rotation by 5 degrees, and the number of rendered triangles increased, along with the render time.

If something as simple as the camera angle changes, it is easy to change something in the project, profile it, and reach the wrong conclusion just because your view angle shifted a bit.
So how do you profile a game properly and know that your optimizations are going in the right direction?
In this article:
A few examples of wrong practices
My profiling philosophy
What data to look for when profiling
An example of profiling built-in occlusion culling and the GPU Resident Drawer in Unity.
___
A few examples of wrong practices
To explain my point of view, I will show you a few wrong profiling practices that lead to wrong conclusions.
___
First example

Imagine Max. Max has an FPS game.
Max profiled his game and noticed that the particle systems take a big part of his frame time.
Max read an article about the VFX Graph and decided to switch the most common CPU-based particle effects to the VFX Graph.
He profiled the game after the change and noticed that the CPU time for particles was greatly reduced. He left the change in the game, thinking that this optimization was successful.
But was it? This is what really happened:
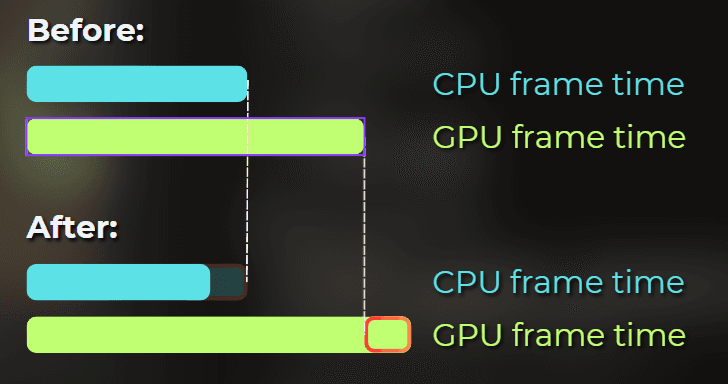
His game was GPU bound. That means the GPU was the bottleneck, and the CPU mostly waited for it to finish each frame. By switching the particles from CPU-simulated to GPU-simulated, he decreased the frame time on the CPU, but increased the time on the GPU.
Max didn't check the overall frame rate after this change. The CPU time dropped so much that he didn't think the game was running slower.
___
Second example

Imagine Bob. Bob is a developer who experiments with project settings to make his game run faster.
Bob decided to play with physics settings.
He profiled the game, changed some values, and profiled the game again while playing normally. He took a screenshot of the general profiler stats and saw that the game runs 10% faster based on the total frame time.
Bob immediately jumped to the conclusion that the new physics settings are better for his game.
Surely he is correct, right?
This is what really happened:
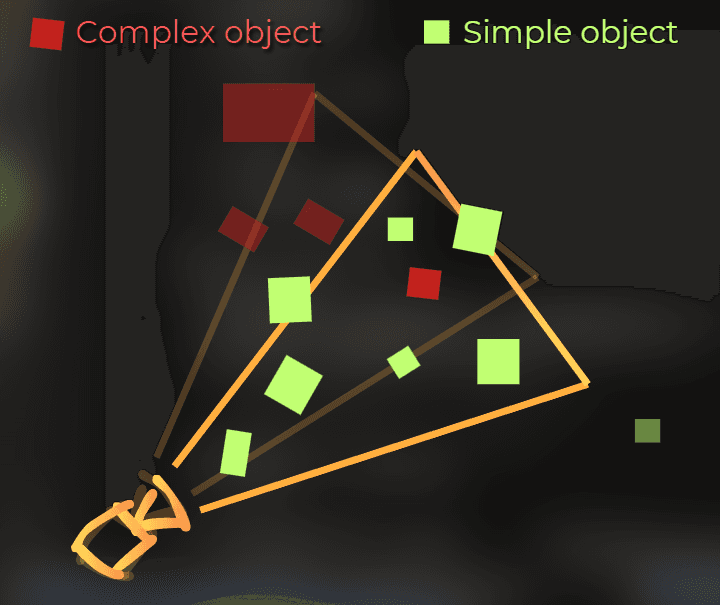
When profiling, Bob just played the game naturally. In the second profiling session, his camera pointed in a slightly different direction, so it captured far fewer heavy-to-render objects in the frustum.
The physics performance stayed exactly the same.
___
Third example

Imagine Rowan. Rowan implemented a new feature: patrolling enemies. He wanted to make sure it runs fast enough.
Rowan launched a profiler and measured over 500 different frames. He just quickly skimmed through 30 different frames and noticed that the performance of the new feature is stable.
And what do you think: was the performance of this feature stable?
This is what really happened:
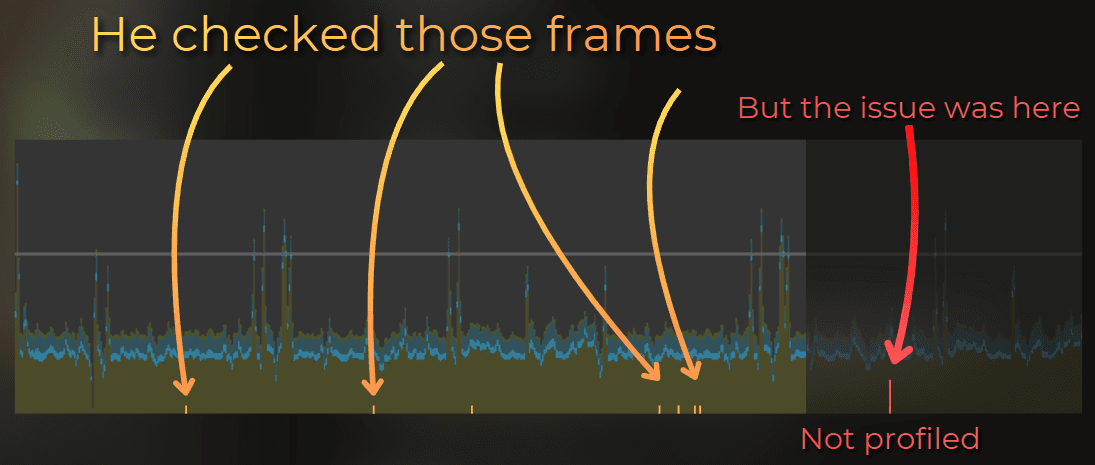
He recorded 500 different frames but checked only a few. The game was running at 60 FPS, so 500 frames is only 8.3 seconds of gameplay.
But the lag spike happened regularly, once every 20 seconds. Unfortunately, it wasn't even recorded in the profiler!
___
My profiling philosophy
In the examples above, everyone was "kind of right" when jumping to conclusions. What was missing was the overall picture or attention to detail.
This is why I'm very careful with profiling. Some optimizations are transactional, where time just moves from one place to another, and some details are hard to catch.
This is my profiling 101:
___
0. Measure in milliseconds, not FPS

Frame rate is the inverse of seconds per frame. So 120 frames per second is 8.33ms per frame.
Milliseconds are LINEAR, while FPS is not.
When you optimize your game from 120FPS to 140FPS (by 20 FPS), you shaved 1.19ms:(1/120FPS) - (1/140FPS) = 8.33ms - 7.14ms= 1.19ms
When you optimized your game from 40FPS to 50FPS (by 10 FPS), you shaved 5ms:(1/40FPS) - (1/50FPS) = 25ms -20ms = 5ms
___
1. Always profile on a target device or a slower PC
Threadripper and an RTX 4080 with 64GB RAM are a nice setup, but they make you blind.

There is no point in optimizing the game when you can only measure on such a strong device. This is why:
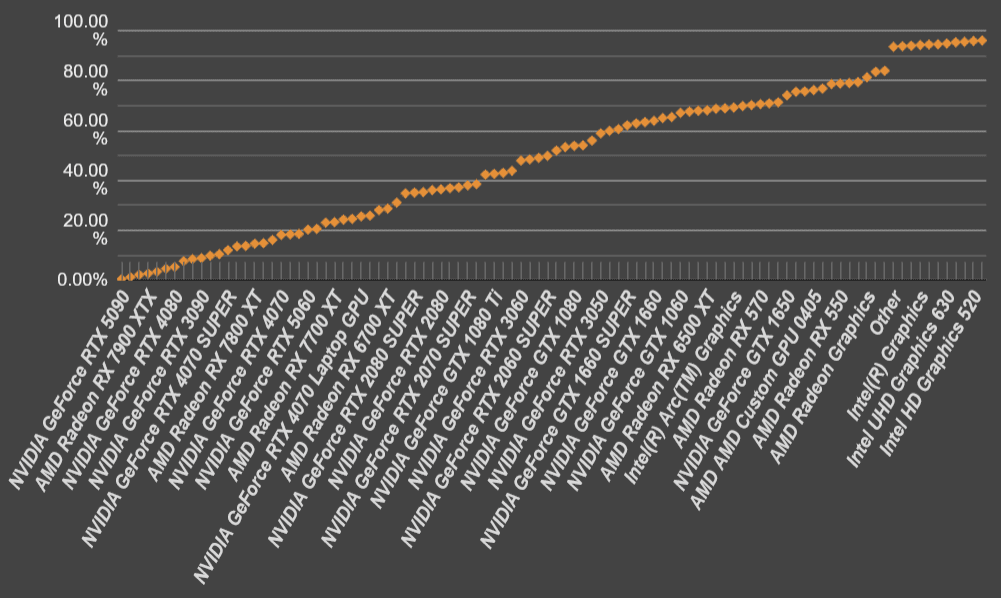
I took the Steam Hardware Survey from December 2025 - freshly baked data (as of writing this article).
I used an AI agent to give each GPU a benchmark score, and I sorted all the GPUs by this benchmark score.
This data is not very precise. I did it in about 20 minutes. However, it is more than enough to estimate the target market size depending on the minimum specs of the game.
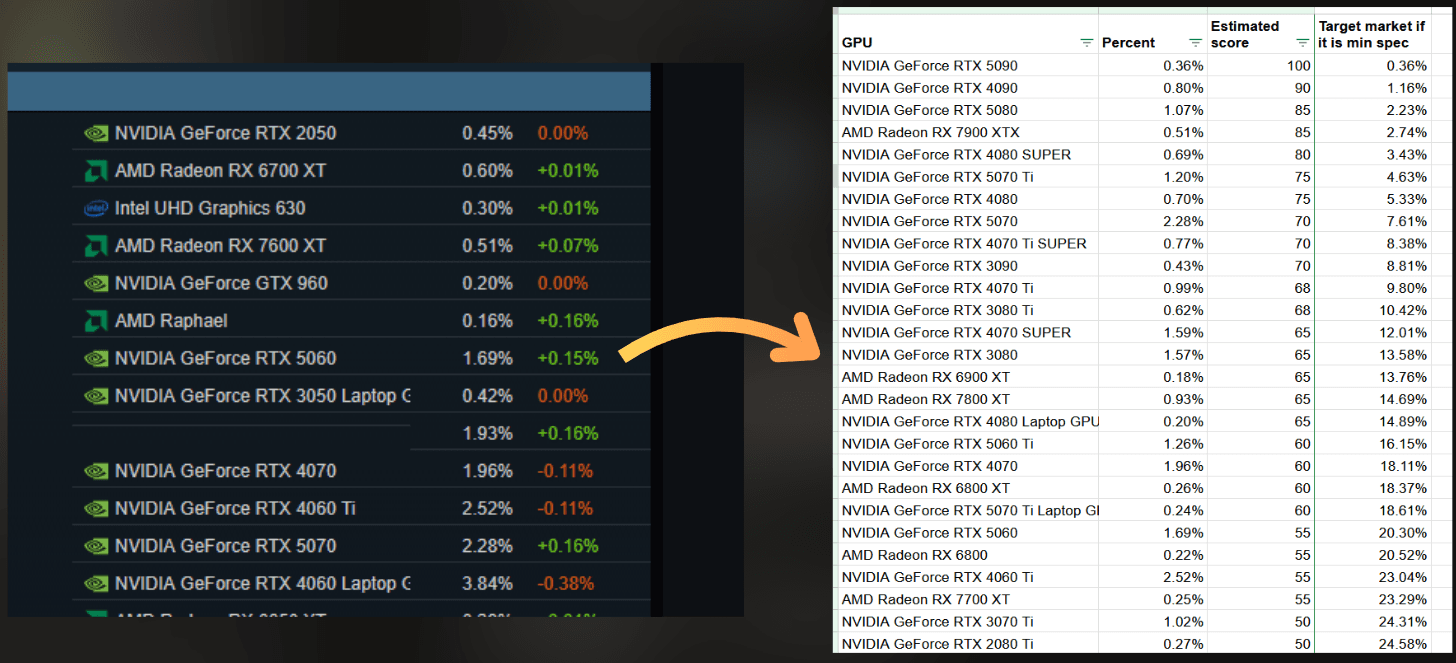
And those are the results:
10% players have RTX 3080 Ti or better.
25% players have RTX 2080 Ti or better.
50% players have RTX 3060 or better.
60% players have RTX 3050 or better.
70% players have GTX 1650 Ti or better
77% players have GTX 1050 Ti or better.
96% of players have shitty integrated graphics or better (the rest play on calculators or I messed up the data).
You can find the full data here: https://docs.google.com/spreadsheets/d/1_VCo_VG2GG7ZXgcBPpOg1WkGqc01m_yIMjFxDsS7cvk/edit?usp=sharing
To make it clear:
When you use 3080 Ti for development and optimize only for that, you lose 90% of the market!
When you optimize the game for RTX 2080 Ti - you lose 75% of the target market!
Be realistic. Lower your expectations. Targeting GTX 1650 Ti instead of RTX 2080 Ti will triple your target market.
I still keep the GTX 1050 Ti and I use it when profiling.

In my free time I develop my own projects using:
RTX 3060
10th gen i5 CPU (i5-10400F 2.90GHz).
64 GB RAM
Every stronger device makes it harder to notice issues.
___
2. Establish the frame time budget

To achieve a stable 60FPS for your game, I can't exceed 16.6ms of frame time on the CPU and the GPU.
Imagine that those 16.6ms are your budget, like money. You can spend it on internal systems, but you can't spend more than you have.
And you spend this budget on your minimal target specs.
Games use many internal systems. For example:
Gameplay logic
Physics
UI
Networking
Pathfinding
Audio
Particle simulation
Animation
Analytics
Rendering
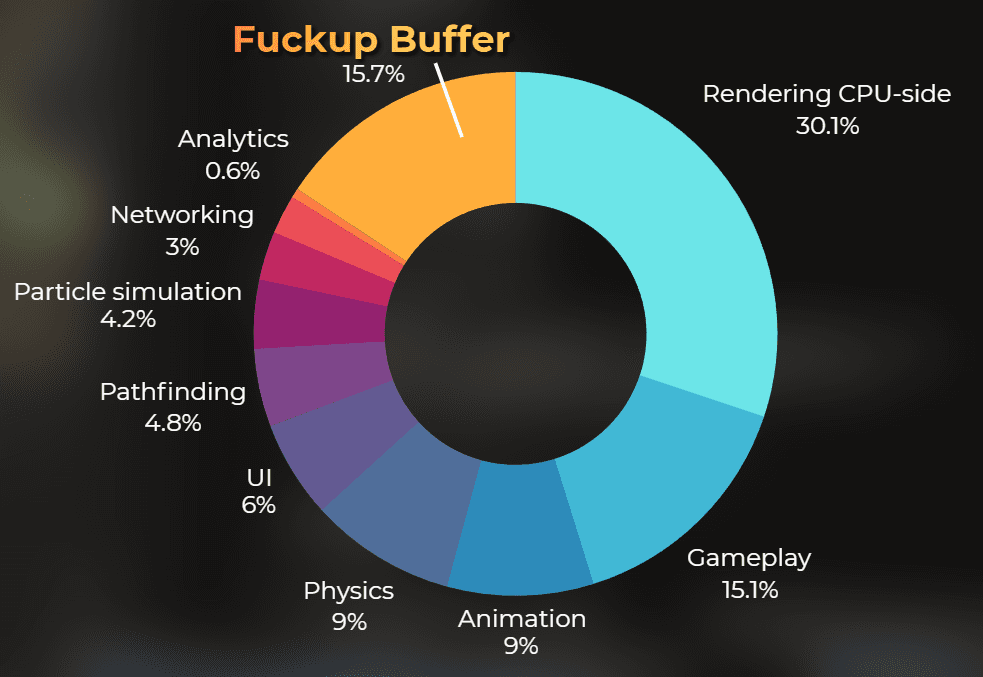
When I start to make a game, I like to think about how much of the frame budget I want to give to each of those systems. Example budgets:
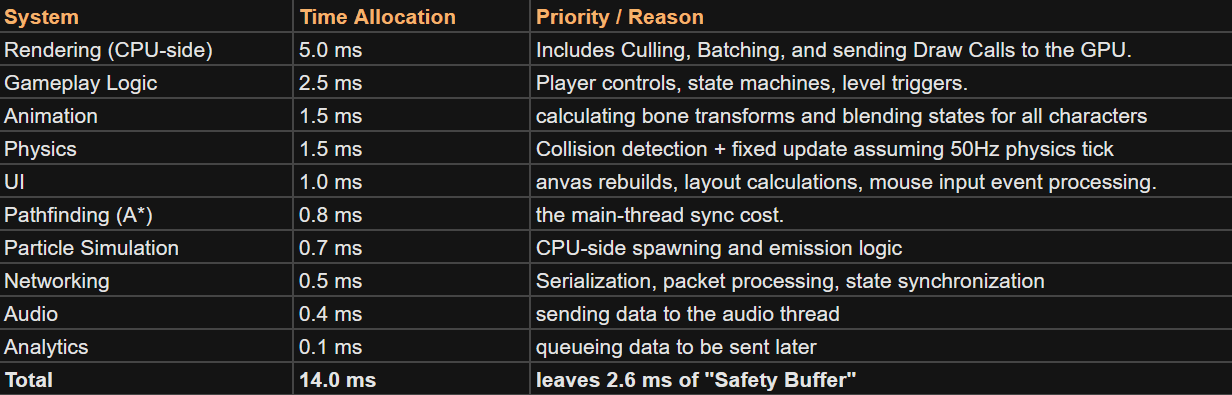
Notice that I left some budget free. I like to keep some budget free because budgets are different for each level in the game. I want some space for game elements to work together.
These buffers are never fixed, but the more complete the game is, the more stable they become.
If you want, you can add more detail over time after you see what is "normal" for your game.
Example budget of the UI rendering (distributed 1 ms)
Updating the data - 0.2 ms
Layout calculation - 0.2 ms
Graphic rebuild - 0.3ms
Sorting and culling - 0.1ms
Sending to the GPU - 0.2ms
If I set these budgets up front during development, it is easier to see whether the game is going in a good direction in terms of optimization.
I also like to predict budgets for the GPU:
Then, the rule is simple. When you exceed the planned budget, you need to optimize it, or cut the budget of the other features.
___
3. Profile the CPU, as well as the GPU
Games run on two main units: the CPU and the GPU. The CPU is mostly responsible for game logic, physics, audio, and kicking off rendering. The GPU is responsible for rendering everything on screen.
They operate in parallel and both need to fit within a target frame rate. I always optimize the part that has the slower frame time.
So when I target 30 FPS, I need to fit both into 33ms. Each frame also needs some time for synchronization, so it's good to target 32ms or below.
When I measure:
CPU: 27ms,
GPU: 43ms
I will optimize GPU and also include optimizations that shift the workload from the GPU to the CPU.
Do you remember Max? If he profiled both the GPU and the CPU, he would notice that moving the particles from the CPU to the GPU made performance worse.
___
4. Deterministic benchmarks
When I profile, I try to use scenarios that are as deterministic as possible. Determinism is key. I want to measure a single change and nothing else. The error should be as small as possible.
In some games it is not possible because of their nature (for example, randomness in gameplay), but I always try to get the most deterministic profiling scenario.
The camera should be in the same position.
The camera should always look at the same target.
The same gameplay moment should be profiled before and after each change.
All the required data should be collected during that benchmark to look at the full picture.
Other things I like to lock down:
Build vs Editor (prefer a build if possible).
Resolution and graphics settings.
VSync and frame limit (so they don't hide stutters or bottlenecks).
Warmup frames (so shader compilation and caching don't skew results).
This is why automation and save systems play a big role in profiling.
Only if Bob used the more deterministic scenario for profiling, he would notice that the change in physics didn't matter.
___
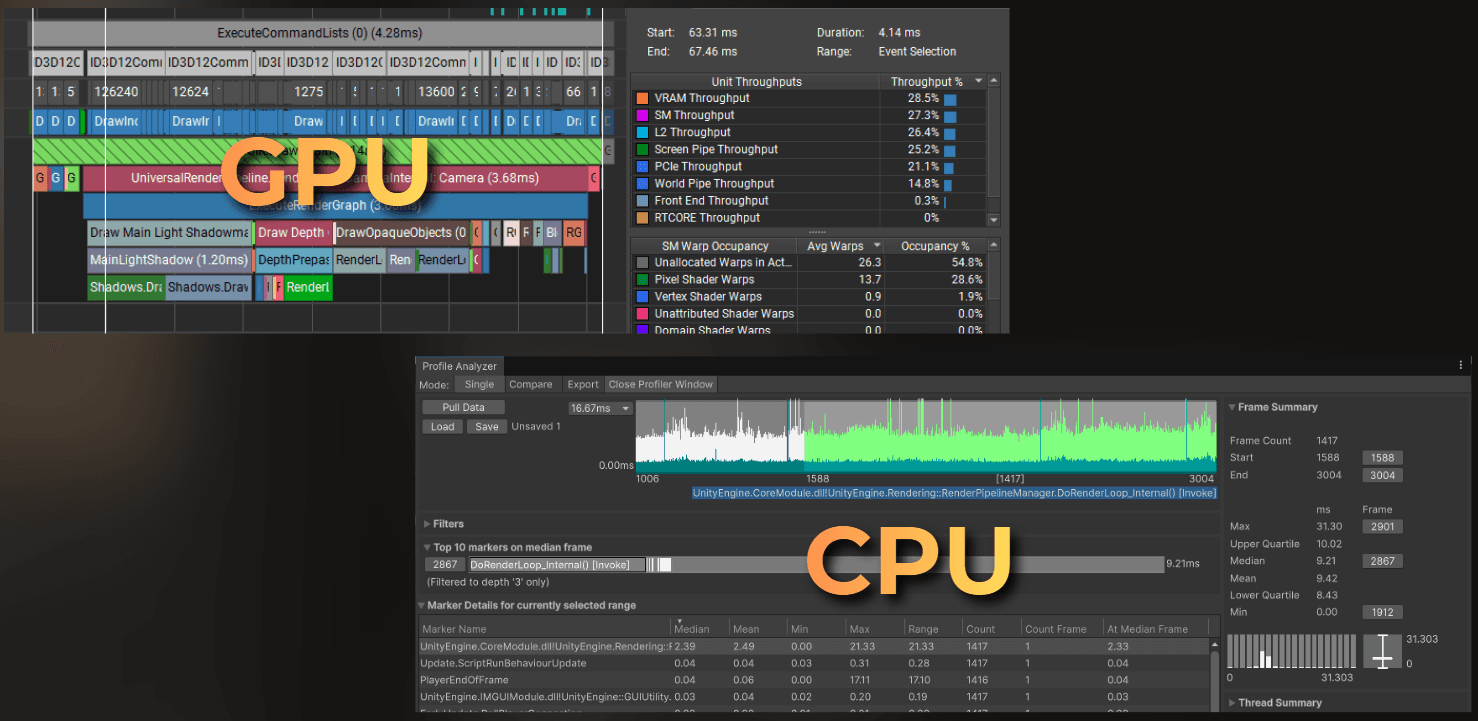
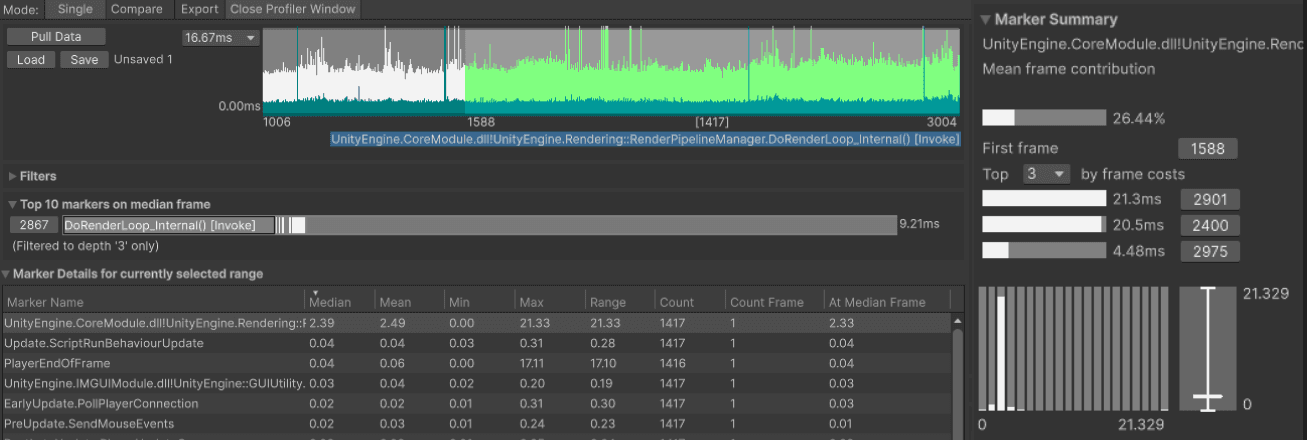
5. Rely on statistics - no frame picking
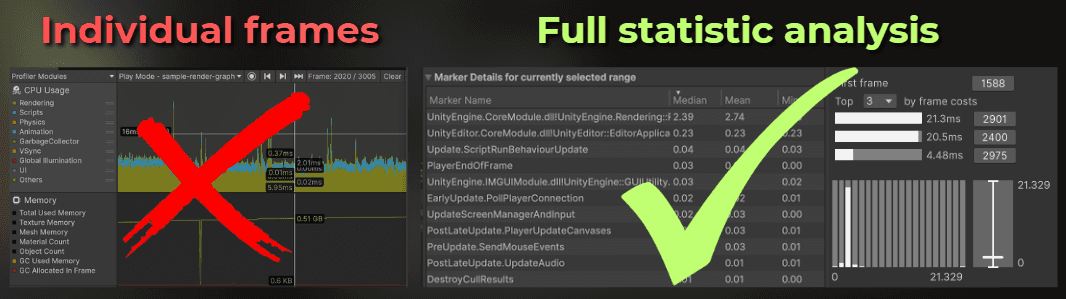
Profiling individual frames can be misleading, because you can miss important details. If your game runs at 60 FPS, collecting 1000 frames is just 16 seconds of gameplay.
There is no practical way to browse that much data without proper tools. I like to perform a statistical analysis of the collected data using as much data as possible.
I calculate the 3 worst results (max), 3 best results (min), median, average, and percentiles from thousands of frames across different game scenarios.
In Unity you could use Profile Analyzer to do this.
Or write your own tools that sample data from the internal profiler each frame and calculate what you need in an automated benchmark:
___
6. Profile the whole game - not only the first levels
Imagine you create a bridge-building game where the first levels are simple. Over time the mechanics get more complex, and the final level requires a super megabridge with lots of dynamic elements and lots of simulation time.
You can't just open the profiler in the first levels. You need a save file, cheats, or automated gameplay. Do anything that lets you quickly reach the intensive parts of the game.
7. Save and store your profiling data
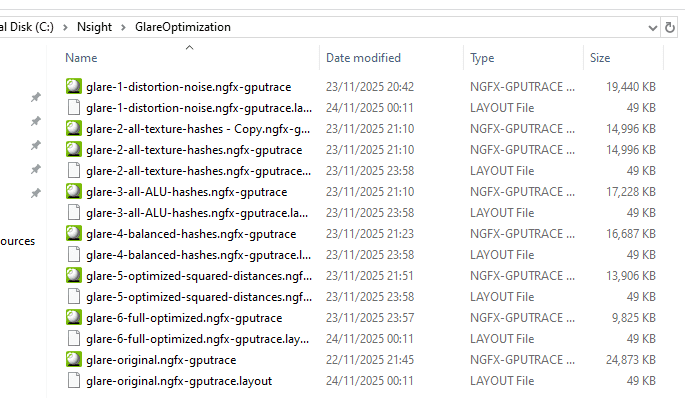
Profilers have an option to save the data into a file for a reason. When I optimize my projects I like to store the profiling data from each step in a well named file.
In this way, at any time I could go back and check "how well was UI running two weeks ago, because I don't remember having an issue with this scroll view"
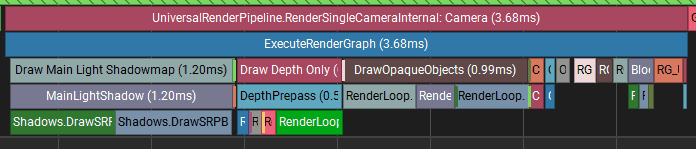
I also save all the profiling data during a single optimization session, because I could compare every single change with the other one. Look at the image above, it contains GPU profiler snapshots from the original project, and 6 optimization steps.
Those files are from the optimization I did in this article: https://www.proceduralpixels.com/blog/i-made-this-shader-run-4x-faster
___
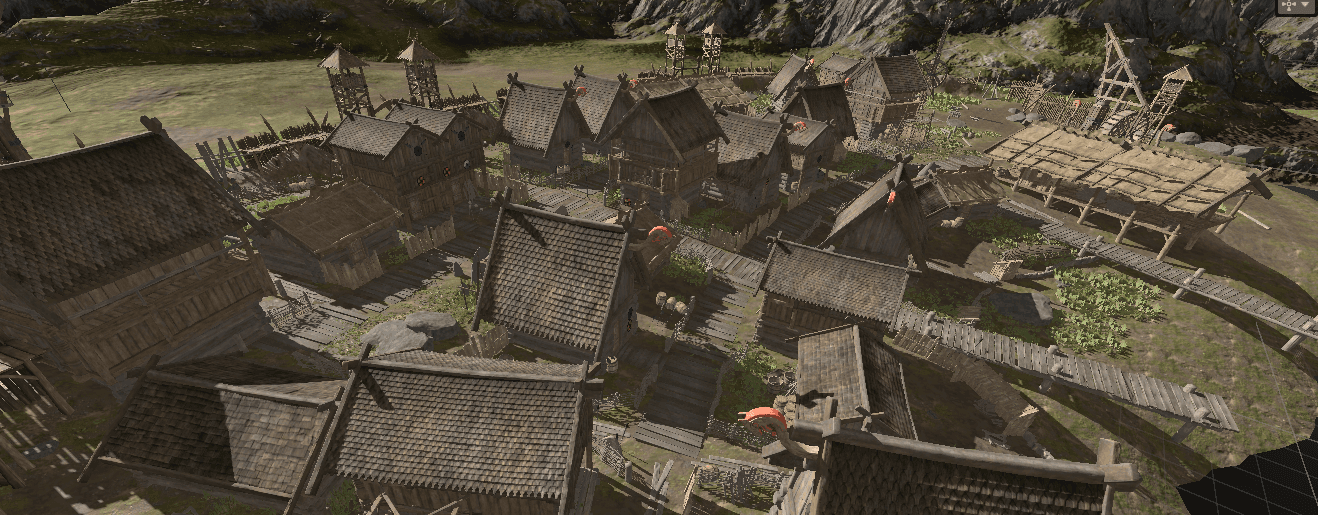
Profiling Unity's occlusion culling
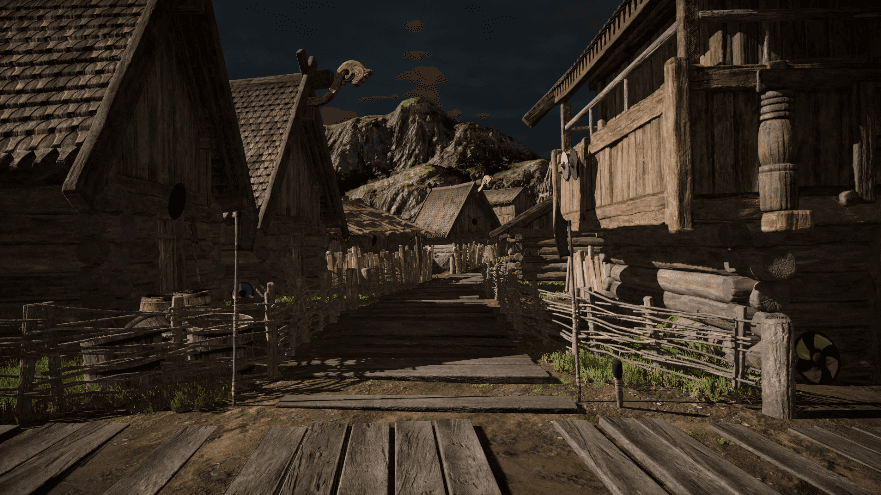
To avoid leaving you without an example, I will quickly profile this scene to decide whether I should enable built-in occlusion culling or the GPU Resident Drawer in Unity.
Let's make a few assumptions:
Camera is always close to the ground
Player can walk only inside the village
Target device would be my workstation: RTX 3060, 10th gen i5 CPU (i5-10400F 2.90GHz).
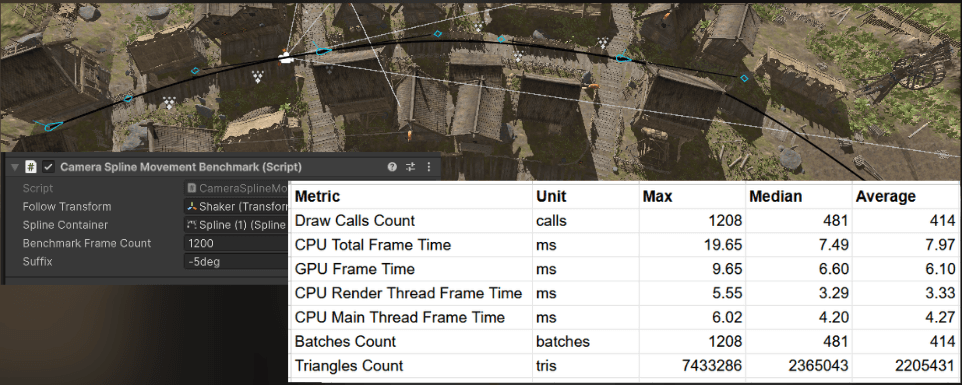
To create a benchmark, I want a camera that profiles the scene the same way each time I change something. Then I need to collect the right data to pick the best occlusion approach.
My plan:
Make a camera follow the spline through the village.
Collect the profiling data each frame when the camera follows the spline
Calculate statistics from all the frames
Run benchmark in three scenarios: without occlusion culling, with baked occlusion culling, with GPU resident drawer
Compare GPU render time for the same scenarios.
___
1. Make a camera follow the spline
I created a spline through the village.
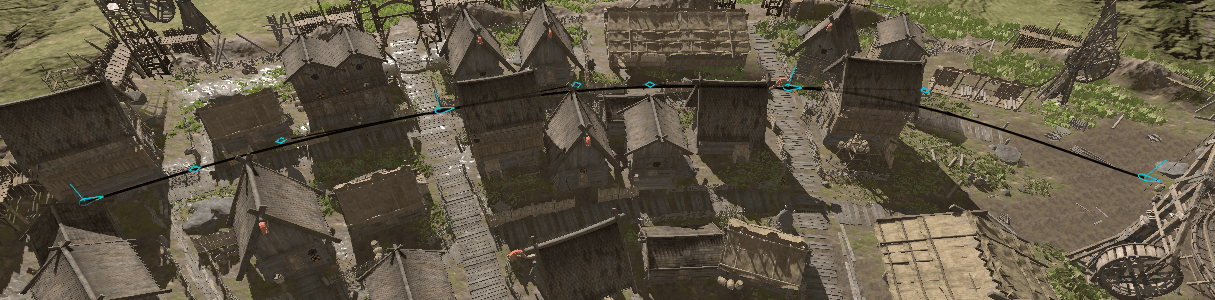
Then I wrote a simple script that moves the camera along the spline over a fixed number of frames:
This is the component:
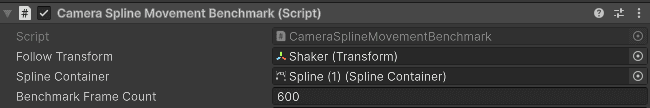
And the result:
___
2. Collect the profiling data each frame
Now let's collect the required data. I opened the Unity Profiler and then the Module Editor. Here I can see all the data Unity collects per frame.
I chose the performance markers below. It is a good summary of the GPU and CPU, and it should be enough to decide which occlusion option is better. However later you will see, that GPU measurement in Unity is not precise here.
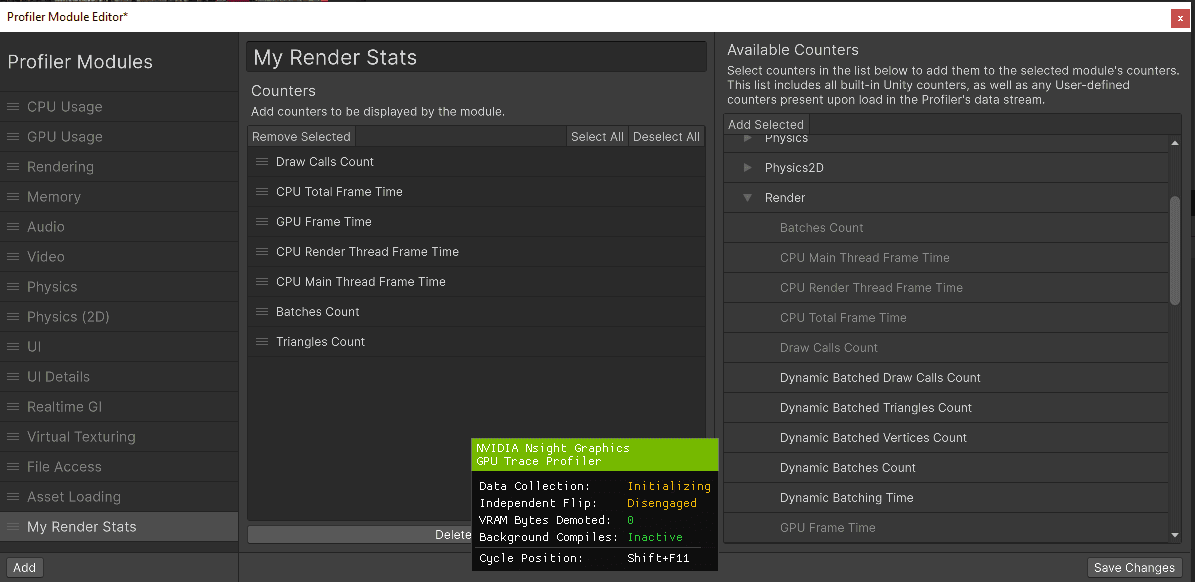
I created a C# class that collects data for a profiler marker:
And I created a collection of these metric recorders based on what I found in Unity's Profiler Module Editor.
In each frame, I collect the data and later write it into a CSV file. I included a warmup.
___
3. Compute statistics
When the benchmark runs, it collects data. I could plot it, or I could compute statistics. I went with statistics.
I added this code to the MetricsRecorder. It computes min, max, median, and average. When profiling, I focus on the median difference.
Then I save all the results into a CSV file for easy comparison:
After running the benchmark, I got this file as a result. The min values are messed up sometimes. I'm not sure why, but when profiling I like to focus on the median, so I will ignore it for now (also because writing such articles takes some time and I want to go to sleep xD).
___
4. Profile three different scenarios
Ok, let's profile three different scenarios:
No occlusion culling
Baked occlusion culling
GPU Resident Drawer
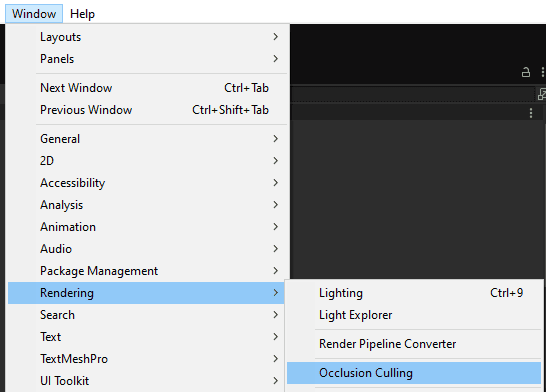
First of all, I baked the occlusion culling using this menu. This will be my second scenario:
I benchmarked a few parameters and found that this works quite well:
Smallest Occluder: 2
Smallest Hole: 0.1
Backface Threshold: 100
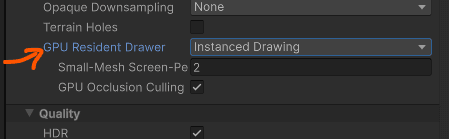
And I enabled the GPU resident drawer in the render pipeline settings here:
I profiled three scenarios and these are the results. I will compare the median time for simplicity.
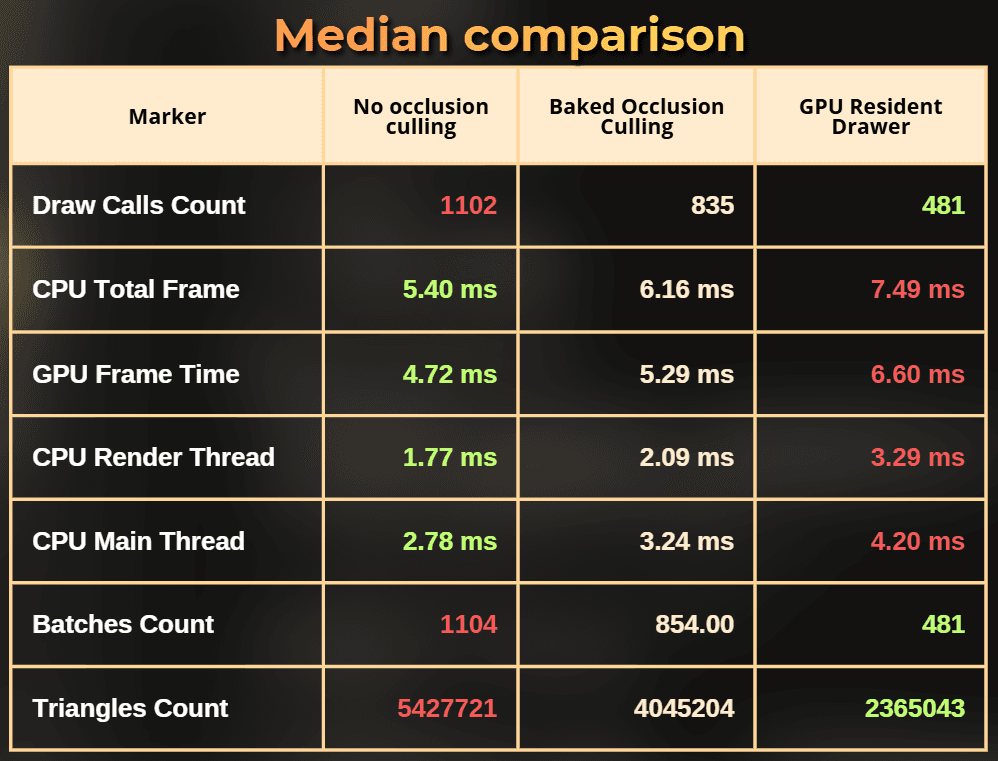
Notice that, while the GPU Resident Drawer was able to greatly reduce the draw call count and triangle count, it is the slowest solution out of all.
So draw call count and triangle count doesn't always reflect the frame time!
And the fastest solution for my setup was to not use any occlusion culling at all.
Counterintuitive? Yes. This is why we profile.
___
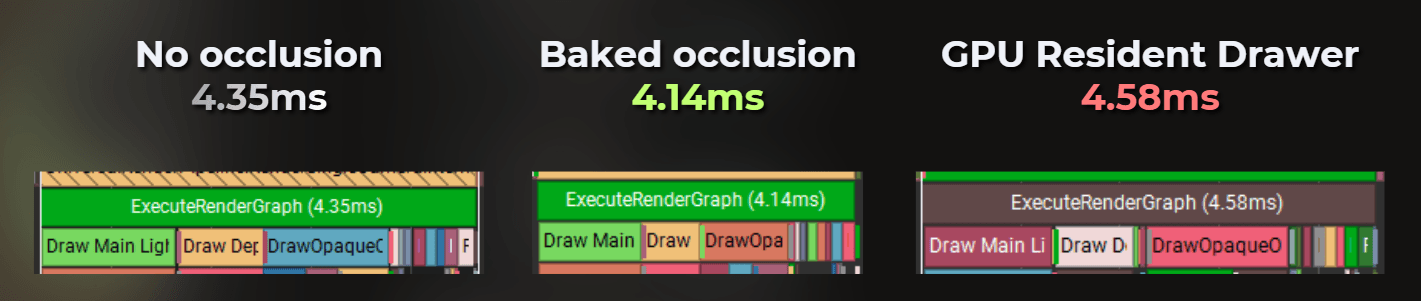
5. Profile using a native GPU profiler
Now, let's compare the GPU using more professional tools, because GPU timings in Unity are usually not very precise.
I set the camera position to this place and compared these three rendering options using Nvidia Nsight Graphics: GPU Trace.
Now things are interesting.
___
5. Summary
For both the CPU and the GPU, in this case the GPU Resident Drawer was the slowest solution. If i picked it only based on the draw call count - I would make my game run slower.
Funny, cause GPU resident drawer is the newest shiny tech from Unity where they market it showing the reduced draw call count.
Baked occlusion culling was a little faster on the GPU, but slower on the CPU. So I would use it as a trade-off in a GPU-bound game. Also interesting how it is that much slower on a CPU if this solution works on a baked data.
Having a project not using any occlusion culling was the fastest option. Isn't that interesting?
___
Summary
Profiling is sensitive, so it is easy to fool yourself with small changes like a different camera angle or just slightly incorrect profiling practice. Those are the rules I like to follow:
Always measure in milliseconds, never FPS
Always profile on a target device, or a slower PC.
Establish the reference frame time budget.
Profile the CPU and the GPU.
Do a deterministic benchmarks.
Rely on statistics, no frame picking
Profile the whole game, not only the first part.
Save the profiling data and store it
In the next article I will try to create my own occlusion culling and make it faster than Unity's built-in solution for this exact same benchmark.
The processed data from the Steam Hardware Survey - December 2025: https://docs.google.com/spreadsheets/d/1_VCo_VG2GG7ZXgcBPpOg1WkGqc01m_yIMjFxDsS7cvk/edit?usp=sharing
Want me to analyze your game?
Currently I’m building a hands-on GPU optimization course, and I want to include real production case studies from indie games.
So here’s my offer:
I’ll analyze your already released game for free and share actionable performance findings.
The only condition:
you grant me a license to reuse the case study and findings in future educational content (including the course).
If that sounds fair, drop me a DM message on LinkedIn!