Case study
Beginner
Profiling
Optimization
Your game can be faster, because you restarted your PC
10 min

After a full day of work, I realized that I hadn't restarted my PC and had many programs open at the same time. I thought this was a perfect opportunity to see how background tasks affect game performance and whether it matters if my PC is restarted before profiling.
By reading this article, you will start to understand the impact of background applications on CPU and GPU profiling.
Important: This article documents my observations from profiling a single project. The numbers might not apply in the same way to other projects or PC setups because many variables can affect the results. I have observed similar behavior on a few projects and PCs, but the results varied between setups.
For each profiling session, I captured and compared 10 GPU frames and about 500 CPU frames after the warm-up period.
___
I decided to profile my hobby project
This is my pet project for experimenting with rendering techniques in Unity. It is my graveyard of partially implemented ideas... But at least partially implemented!
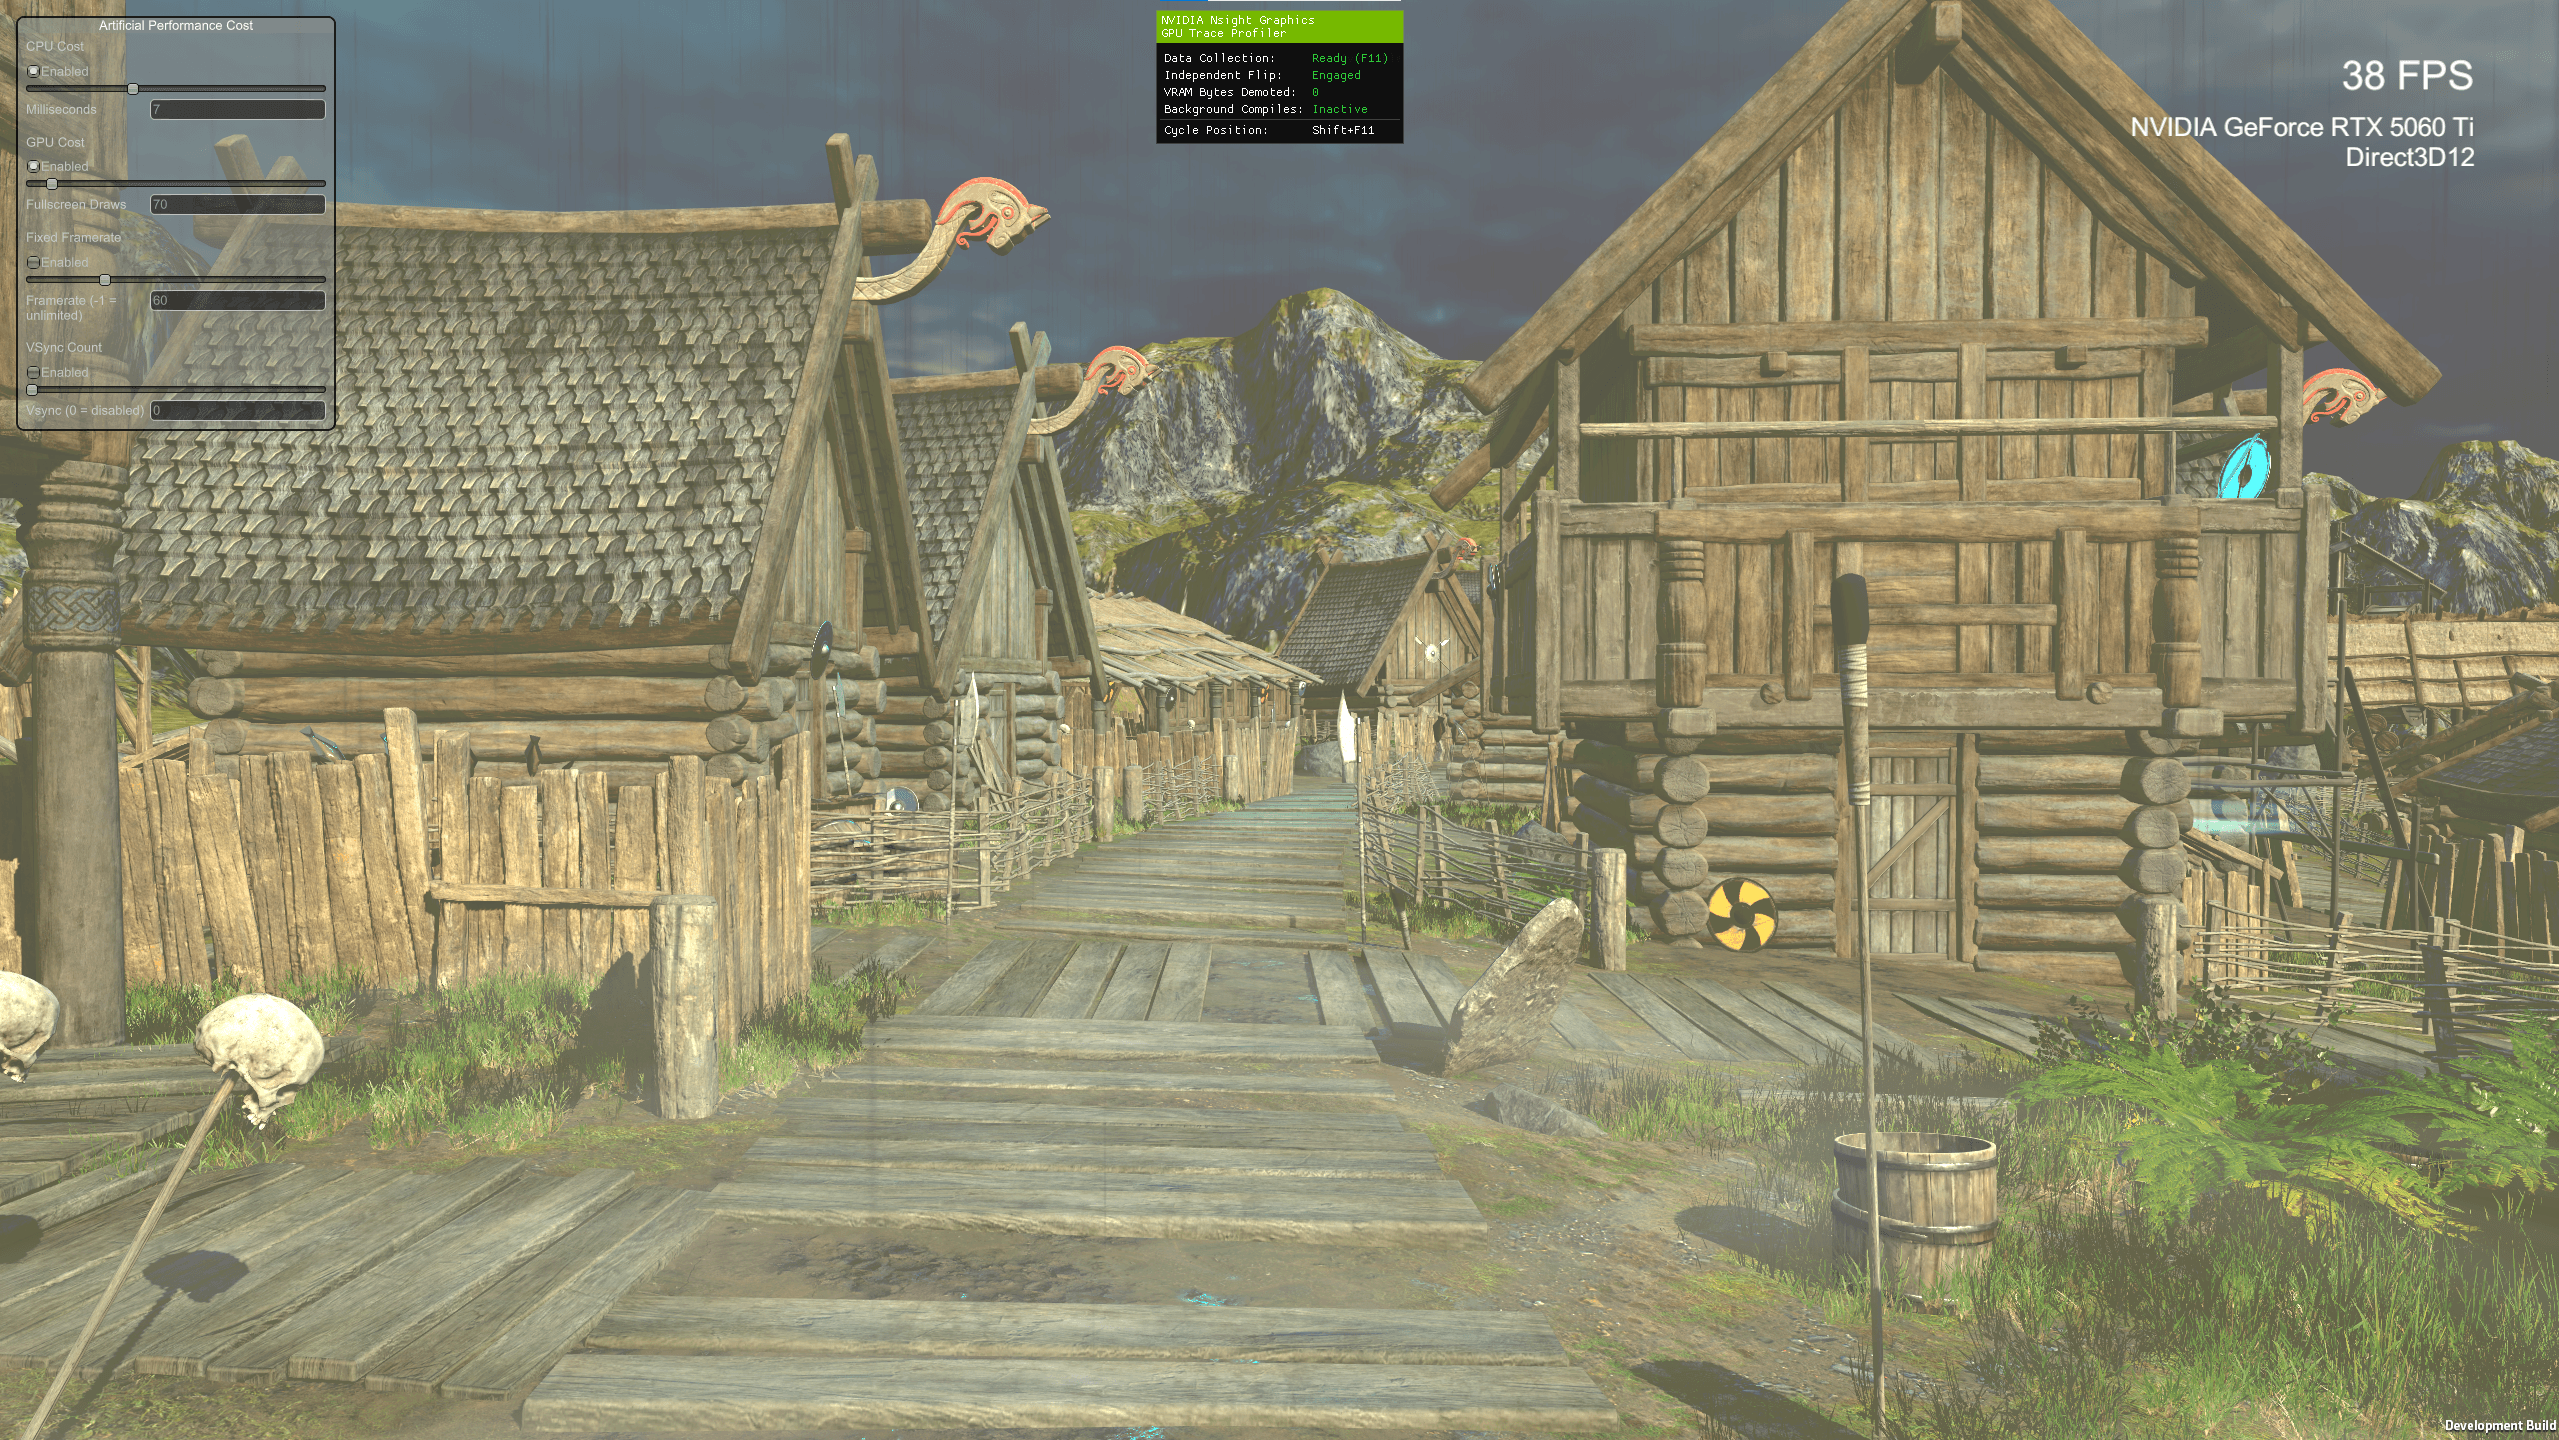
I have sliders that allow me to add fullscreen transparent draws and artificial wait time to the main CPU thread. The game runs in exclusive fullscreen mode at Full HD resolution. VSync and frame limiting are completely disabled.
I profile on Windows 10 using Unity 6000.5.6, an i5-10400F, an RTX 5060 Ti, and Nvidia 610.62 DCH drivers.
___
First profiling - with a lot of background apps
After a full day of work, I started to work on the articles and I had many programs opened:
Notepad++
Elgato Camera, Full HD recording with the Nvidia SDK used for background blur
YouTube playing a video in the browser
Obsidian - for article writing
Unity Editor - with my project, the Scene view visible, and the Unity Profiler and Profile Analyzer available for CPU profiling
Discord, Spotify, and Unity Hub in the background
Nvidia Nsight Graphics for profiling
The game itself running in exclusive fullscreen.
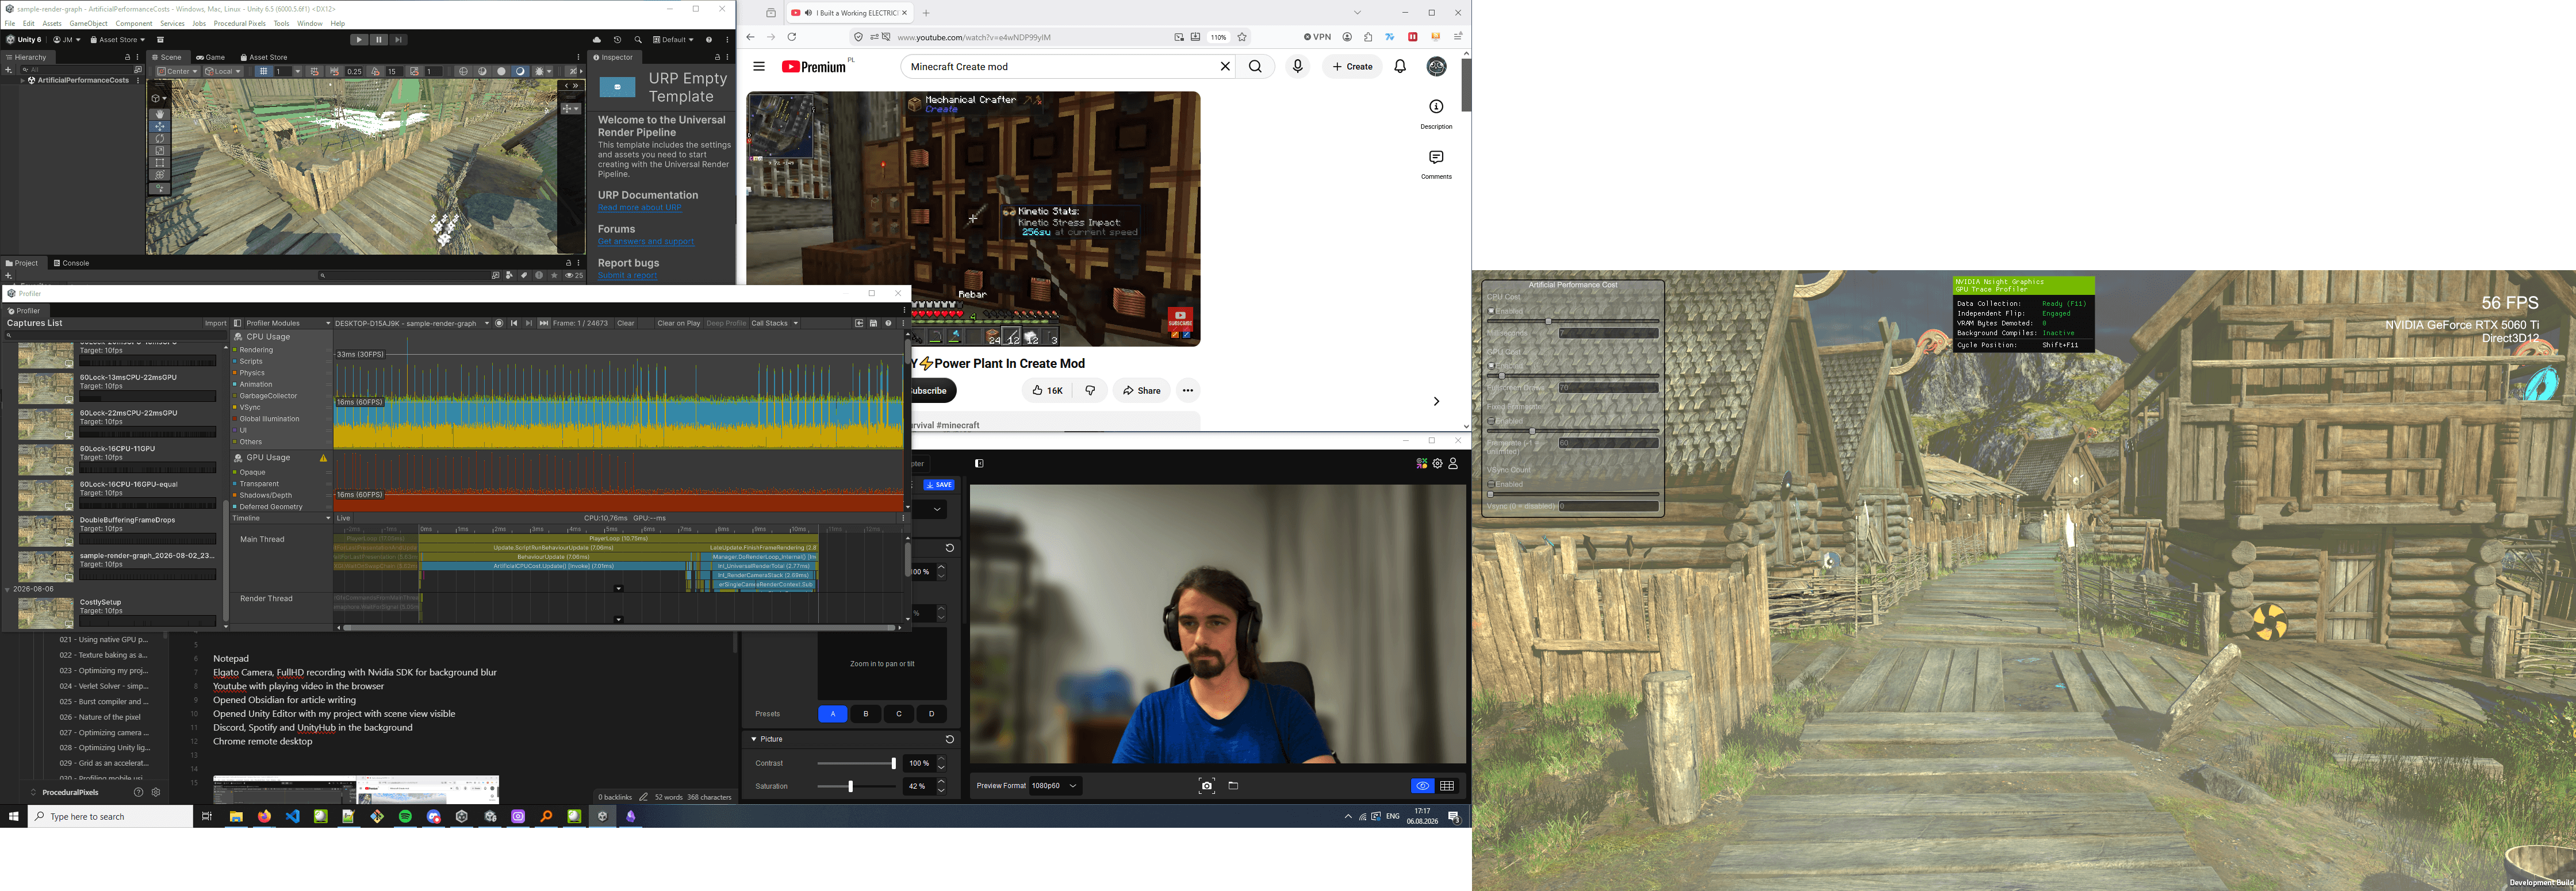
And I think this is a quite realistic overhead we can run in everyday work. Imagine this scenario:
You're working on a project with your game engine and IDE open. Someone at work calls you through Slack or Discord. You both enable your cameras, and you decide to profile something in the build. You share your screen during profiling, open the game on the same PC, and profile it. Notice how many programs you now have open:
Communication app, capturing your camera, rendering video from two cameras, recording your screen during profiling, and encoding it for streaming.
Unity Editor, open with your project and already consuming a lot of VRAM and RAM.
IDE, maybe Visual Studio, just a text editor that takes 8 GB on your hard drive...
Web browser, probably open in the background
Nvidia Nsight Graphics, for GPU profiling
The game, which you want to profile
Notice that the game needs to run on the same hardware as all those applications!
Let's see what issues I will have with profiling.
GPU performance with a lot of background apps
Luckily, Nvidia Nsight Graphics can report when other programs interrupt rendering. Other programs appear as red crossed lines across the profiling window.
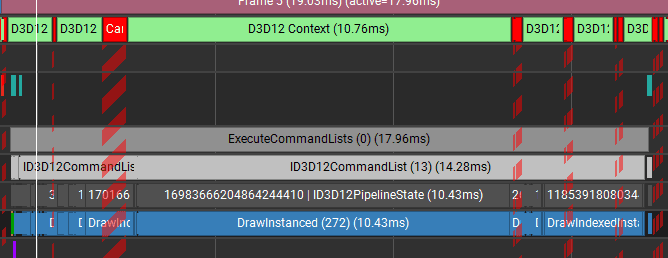
I can see which programs are causing the issue in this profiler, but many other profilers do not provide this information.
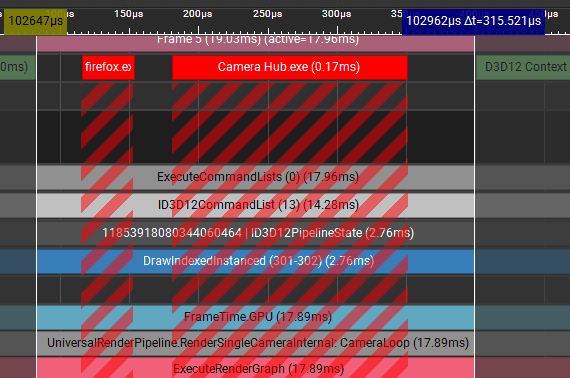
An example frame rendered in 17.96ms, with 8 interruptions:
0.13ms for CameraHub
0.67ms for CameraHub
0.11ms for Firefox
0.22ms for CameraHub
0.8ms for Firefox
0.23ms for CameraHub
0.08ms for an unknown application
0.18ms for CameraHub
In total: 2.42ms
So I can assume that the frame could render in 15.54ms (17.96ms - 2.42ms). However, many in-engine debug views cannot separate these interruptions from the measurement.
The measurement error here is ~13%, which is quite high for a whole frame. This is a large error when measuring small optimization tweaks!
But when I'm focued on specific markers, it gets worse:
One marker, 3.60ms.
:center-50:

The same marker in a different frame with no interruptions: 2.47 ms - more than 1ms faster!
:center-50:

I can assume that when other applications are present it is better to focus on the markers with shorter render time, but it may be the outlier when something was rendered differently. The shortest frame is still useful as supporting information, but it should not be used alone.
So if I were to use this profiling session results, I would be picky and select frames with minimal interruptions.
For example, this frame has only three interruptions, taking 0.49ms in total:
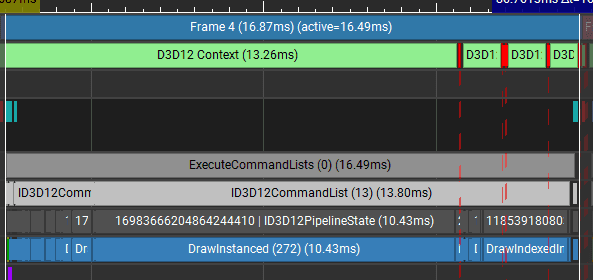
So, In general, frame time varied from 16.40ms to 17.89ms.
CPU performance with a lot of background apps
For the CPU, I will not profile the whole frame. I will focus on a single performance marker because the application was bottlenecked on the GPU, and significant time on CPU was on waiting for the GPU to finish the rendering.
I decided to focus on PostLateUpdate.FinishFrameRendering, the part of the frame where the main thread prepares data for the render thread. Important note that this marker doesn't contain any "wait for GPU" events.
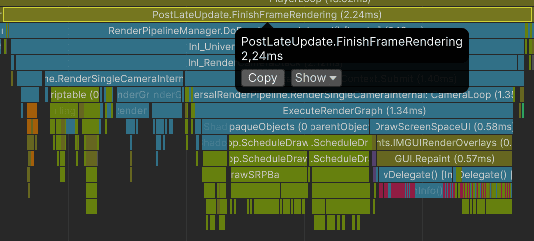
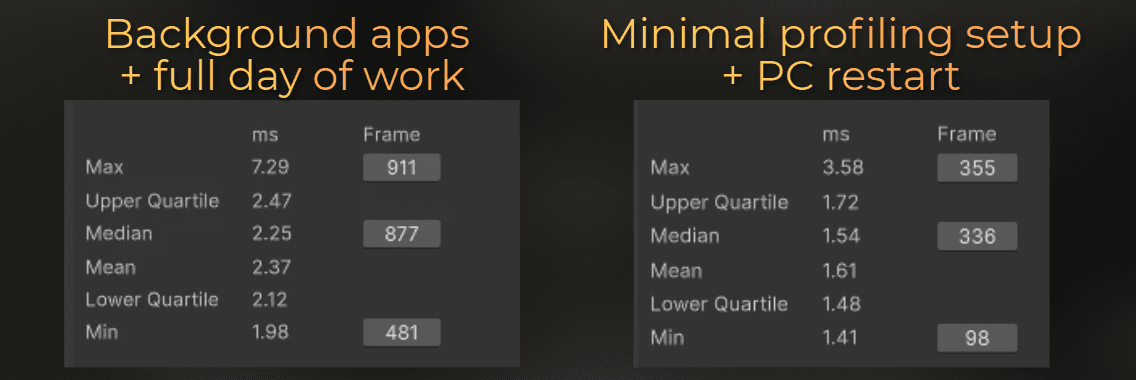
For this, I used Profile Analyzer and analyzed ~500 frames. The median marker time was 2.25ms, and the mean was 2.37ms.
:center-50:
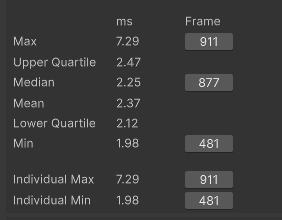
Unfortunately, it is not possible to see interruptions here, so I need to assume that they affected many frames.
The lower quartile was 2.12ms, while the minimum was 1.98ms. I track both the median and lower quartile because they are more representative than selecting only the fastest frame. The minimum remains useful as supporting information.
___
Second profiling - I disabled a few programs
Before the next profiling session, I closed these programs:
Notepad++
Elgato Camera
Discord, Spotify, and Unity Hub
I also closed all panels in Unity Editor and left only the Profiler and Profile Analyzer.
But I left:
YouTube playing a video in the browser
Obsidian open for article writing
Unity Editor open with my project and only the Profiler and Profile Analyzer visible
Nvidia Nsight Graphics
The game
This should represent a scenario where I work alone and have a profiling session with with some YouTube mumbling in the background.
GPU performance with a few background apps
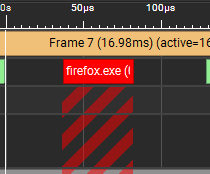
Unfortunately, I can still see interruptions from my browser and an unknown application.
:center-50:
:center-50:
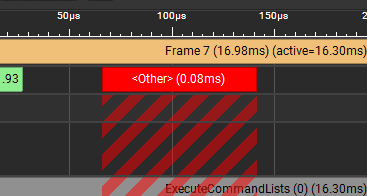
However, it is possible to find some frames with very limited interruptions:
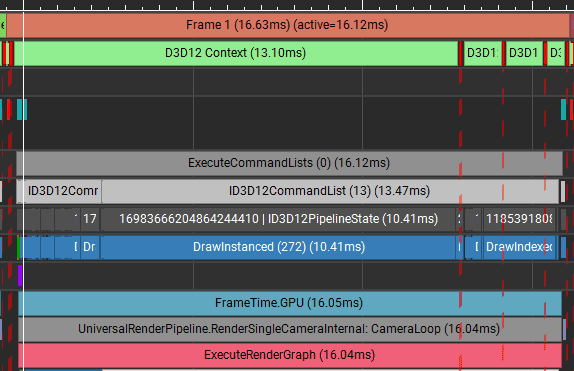
The frame-time range dropped from 16.40-17.89ms to 16.02-16.45ms.
CPU performance with a few background apps
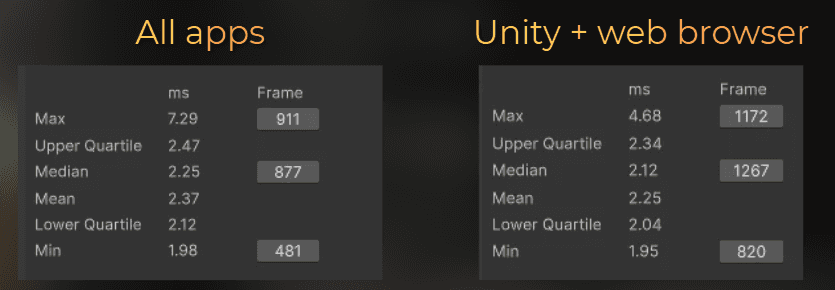
As with the GPU, the times dropped also on the CPU
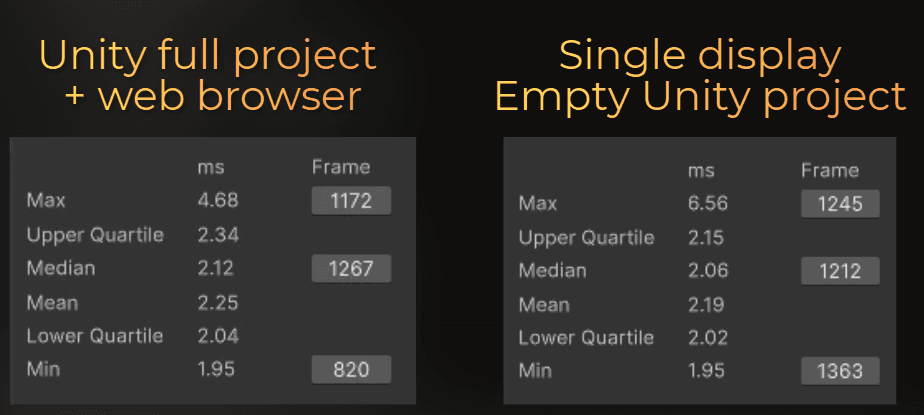
Median time: from 2.25ms to 2.12ms
Mean time: from 2.37ms to 2.25ms
Lower quartile: from 2.12 to 2.04ms
Min: 1.98ms to 1.95ms
___
Third profiling - minimal setup
For the next profiling session, I created a minimal setup:
I disabled all background applications.
I created an empty Unity project for profiling to avoid interruptions caused by the engine.
I disabled my 1440p monitor and left only the Full HD monitor enabled.
Finally, I ran only an empty Unity project with the Profiler window open, Nvidia Nsight Graphics, and the game I wanted to profile in exclusive fullscreen.
GPU performance with a minimal setup
With this setup, Nvidia Nsight Graphics reported no GPU interruptions. The game was running in exclusive fullscreen on a single display, with no background applications using the GPU.
This does not prove that there were no interruptions. In some Nsight profiling sessions, I observed frames that behaved as if they were interrupted even though Nsight did not report any interruptions. For this test, I assume there were no interruptions because the timings of all events were very stable across many frames.
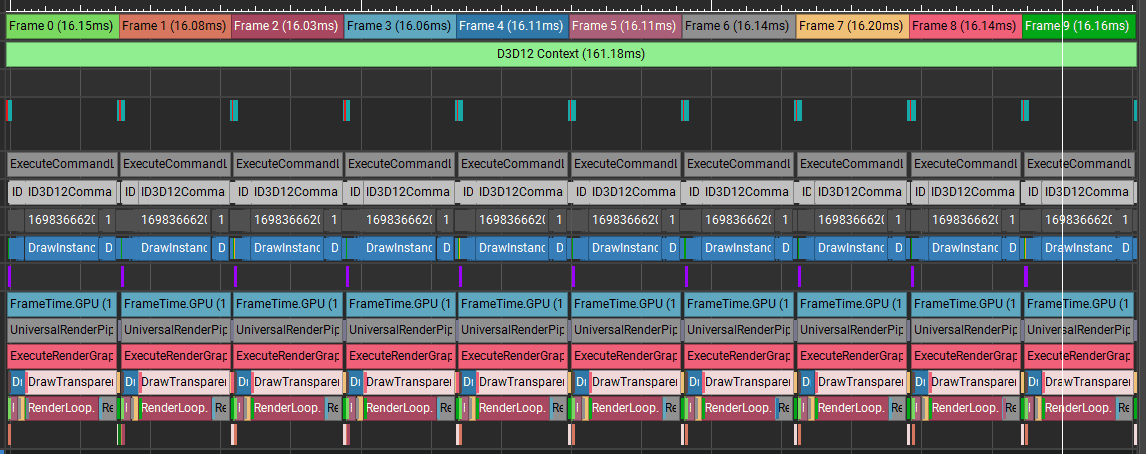
Frame time dropped again, from the 16.02-16.45ms range to 15.60-15.68ms.
Notice that I needed to disable my secondary monitor to make the profiling stable.
CPU performance with a minimal setup
The CPU improvement is also noticeable, but not great. The median time dropped from 2.12ms to 2.06ms, while the lower quartile dropped from 2.04ms to 2.02ms.
___
Fourth profiling - minimal setup after a PC restart
I purposefully ran the previous profiling session at the end of my workday without restarting my PC. Now I want to check whether restarting the PC while keeping the same minimal setup changes the profiling results.
The only change from my previous setup is that I restarted my PC. Everything else remains the same.
GPU performance after PC restart
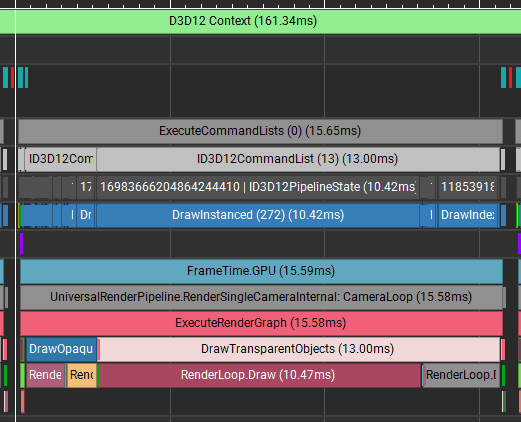
Good news! Restarting my PC didn't significantly change the results. Nsight still reported no GPU interruptions, and the frame-time range changed from 15.60-15.68ms to 15.58-15.65ms. I would interpret this slight difference as measurement error.
CPU performance after PC restart
This is the difference:
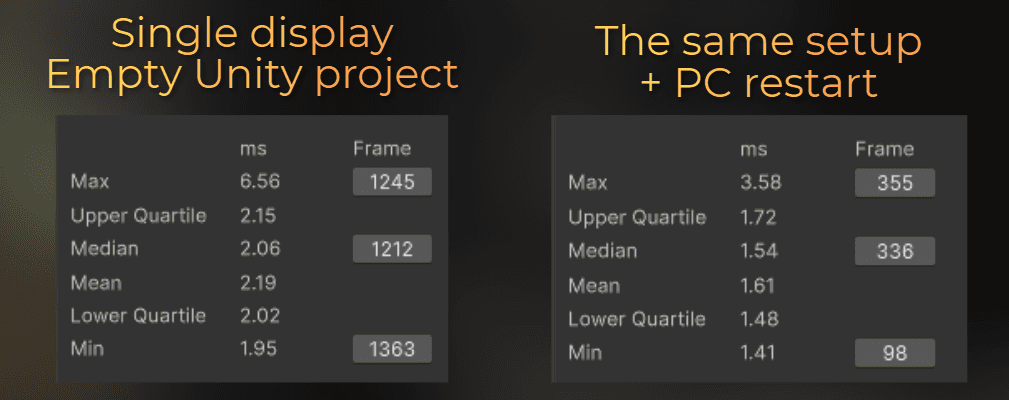
The profiled marker was ~25% faster after I restarted my PC. This is the biggest improvement yet. The median time dropped from 2.06ms to 1.54ms, while the lower quartile dropped from 2.02ms to 1.48ms. Based on this marker, I assume that main-thread execution became ~25% faster in this test.
This means that disabling all applications did not solve the CPU performance problem.
Execution was also much more stable. Below is a comparison of the marker I profiled. Look at the blue graph.
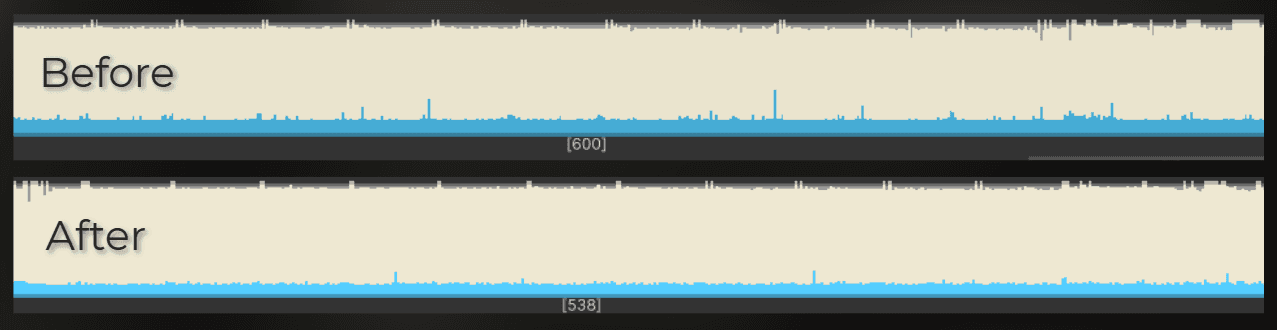
Notice that execution varied a lot before the PC restart. There were more spikes and hills. After the restart, execution was smoother, with only a few spikes.
___
Summary
Interestingy, after a full day of work, disabling all the unnecessary applications didn't improve the CPU stability during the profiling session - only restarting the PC helped.
Without creating a minimal setup and restarting the PC, my CPU profiling measurements contained a huge error. It was ~33% higher than the result after restarting the PC.
This was a single experiment, and there are many variables. I have observed similar behavior on a few projects and PCs, but the size of the difference depends on the setup. A minimal setup and a restart help to reduce measurement error, but they do not guarantee an error-free result. This is why I usually rely on statistics, like median and lower quartiles + lag spikes to validate the performance improvements.
CPU profiling setup | Median | Lower quartile | Mean | Minimum |
|---|---|---|---|---|
All background apps | 2.25ms | 2.12ms | 2.37ms | 1.98ms |
Unity project and web browser | 2.12ms | 2.04ms | 2.25ms | 1.95ms |
Minimal setup | 2.06ms | 2.02ms | 2.19ms | 1.95ms |
Minimal setup after restart | 1.54ms | 1.48ms | 1.61ms | 1.41ms |
The situation was better on the GPU side. In this setup, disabling all applications and the secondary monitor improved GPU performance and made the measurements stable.
GPU profiling setup | Range across 10 captured frames |
|---|---|
All background apps | 16.40-17.89ms |
A few background apps | 16.02-16.45ms |
Minimal setup | 15.60-15.68ms |
Minimal setup after restart | 15.58-15.65ms |
This minimal setup is useful when measuring precise optimizations and small performance changes.
However, it does not prevent players from running background applications or playing without restarting their PCs first. Clean profiling results should guide optimization, but the game should also be tested under realistic player conditions.
___
So, how should I set up a workstation for profiling?
Best setup - a separate PC:
If you can, use a separate PC that you restart before each profiling session.
After rebooting, ensure you launch only the game and nothing more.
DON'T USE VIRTUAL MACHINES FOR PROFILING. You want the CPU and GPU to run your game directly.
Profile the game in exclusive fullscreen with only one monitor enabled.
Run the profilers on another PC through the network.
Avoid screen sharing or streaming when profiling. Ideally, you should run automated tests or have direct access to the profiled PC.
If you need to profile on your PC:
Restart your PC before profiling if you want to keep the results accurate - especially if you need to profile the CPU.
Disable all secondary monitors - leave your game running exclusive on a single screen.
Disable all unnecessary applications, including communication apps and web browsers.
Launch only the required applications: the GPU profiler, CPU profiler, and game.
If you need to connect engine tools, use a completely empty project for profiling to avoid engine overhead.