Tutorial
Beginner
Tech-Art
Basics
Profiling the GPU in Unity Editor
10 min

In this article, I cover: 1.. What a native GPU profiler/debugger is. 2. How I connect Nsight Graphics to the Unity Editor. 3. How I profile DX11 and DX12 in the Unity Editor.
Using native GPU profiler with Unity Editor
When working on GPU optimizations, the workflow loop can be quite long: build the game, profile, then change something in the project, over and over again. Building the game can take a long time, especially as the project grows.
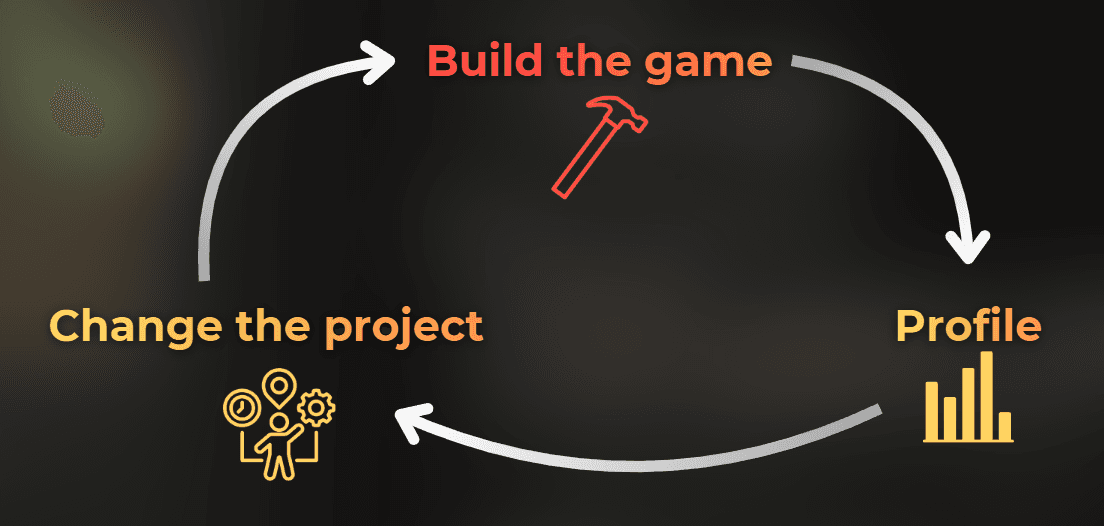
However, it is possible to profile the GPU using native profilers while working in the engine. While working on game optimizations, this is a huge time saver for me.
Here, I will show how I connect a native GPU profiler to the Unity Editor, so I can skip the build process entirely.

___
Prerequisites
This is what I use for this workflow:
Windows (DirectX workflow).
An NVIDIA GPU (Nsight Graphics is NVIDIA-only, in this case RTX 3060).
If you don't have Nvidia GPU, use PIX on Windows or other GPU profiler (AMD Radeon GPU Profiler, Intel GPA)
NVIDIA Nsight Graphics installed:
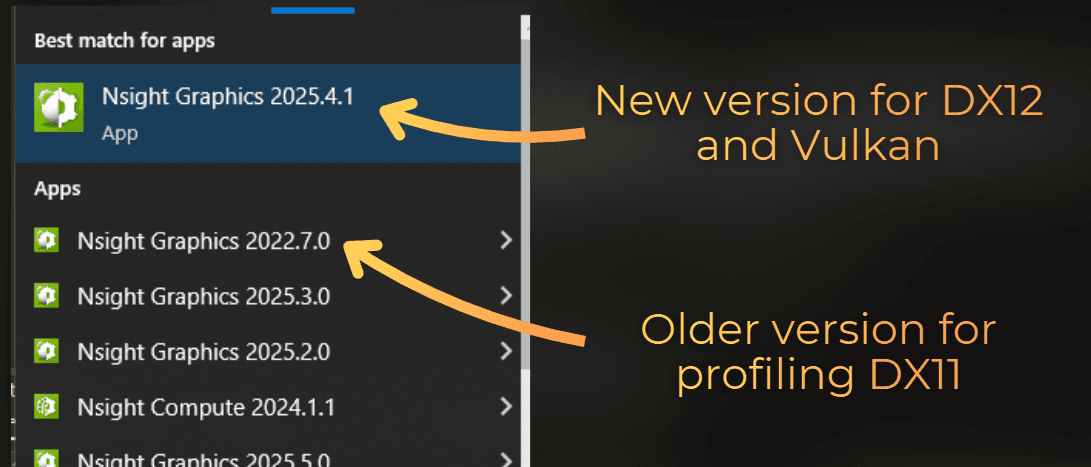
2025.4.1- newer version (for DX12 profiling).2022.7.0- the last version that supports profiling DX11 applications.
Unity project configured to allow DX11 or DX12 in Project Settings (Windows Graphics APIs).
I run Nsight Graphics as Administrator when I want to check hardware performance counters.
I recommend using a mid or low-tier GPU in your PC, such as the one you plan to list in the minimum or recommended specs, because this gives the most useful results.
Using too strong hardware can hide many performance issues.
___
What is a Native GPU profiler/debugger
A native GPU profiler is a tool created by the GPU vendor for inspecting the GPU's performance across different applications. It acts as a middleman between the game application and the graphics driver, analyzing GPU usage while the game runs.
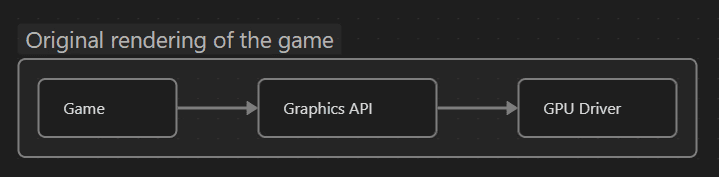
:image-description:
How the original rendering of the game works.
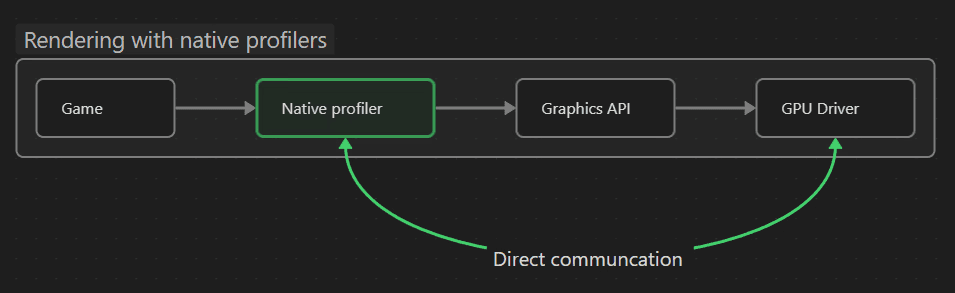
:image-description:
How rendering works when a native profiler is connected.
I use native GPU tools to debug rendering by inspecting graphics API calls, GPU times, and performance counters that help me optimize my game. I can't imagine optimizing without a native GPU profiler.
Usually, the workflow with native GPU profilers is to build the game, then launch it with the GPU tools. The tools inject between the driver and the game and report useful information.
I wrote more about native GPU tools here: How to profile the rendering - GPU profiling basics
There are many tools available. Most of them are created by GPU vendors, like:
NVIDIA Nsight Graphics - for NVIDIA GPUs
AMD Radeon GPU Profiler - for AMD GPUs
Intel Graphics Performance Analyzers - for Intel GPUs
And other tools:
PIX on Windows - debugging and profiling DX12 on Windows.
RenderDoc - debugging graphics API calls
Here, I explain how to connect NVIDIA Nsight Graphics to the Unity Editor so I can immediately see the impact of my GPU rendering and performance changes.
___
How I connect Nsight Graphics to Unity Editor
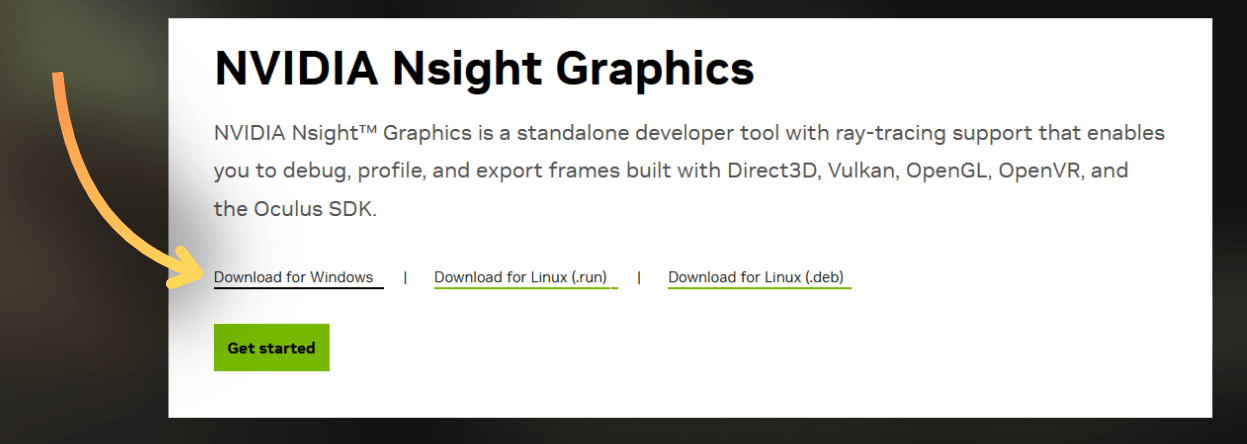
First of all, I installed NVIDIA Nsight Graphics from the official website: Nsight Graphics
I keep at least two versions of Nsight Graphics installed: the newest one and 2022.7.0 (from the download archive). The latter is the last version that supports profiling DX11 applications.
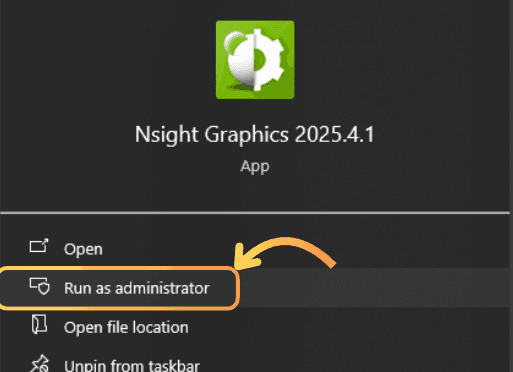
I launch Nsight 2025.4.1 with Administrator privileges. Admin rights are required for Nsight to get performance counters from the GPU driver. Without them, Nsight can't access this data.
:center-50:
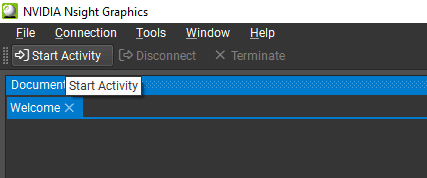
After Nsight opens, I click the Start Activity button.
:center-px:
It is important to understand how these programs work. They launch another application and inject themselves between the driver and the application. All child processes inherit the Nsight injection.
So if I want to connect to the Unity Editor, I need to either open Unity Hub or open the Unity project directly with a specific Unity Editor version.
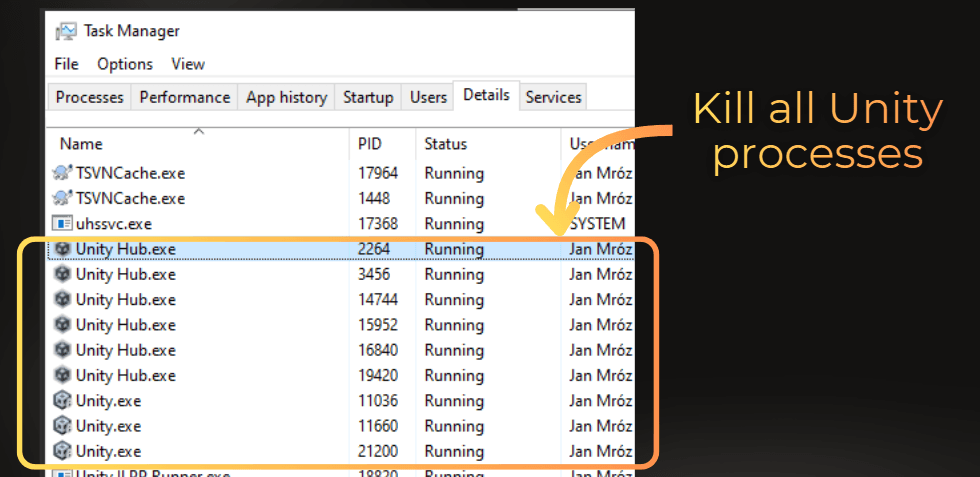
First, I need to kill all Unity processes on my PC. I use Ctrl+Shift+Esc to open Task Manager, then kill every Unity Hub and Unity Editor process.
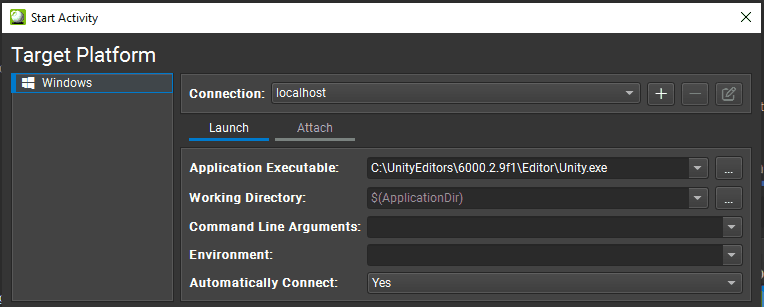
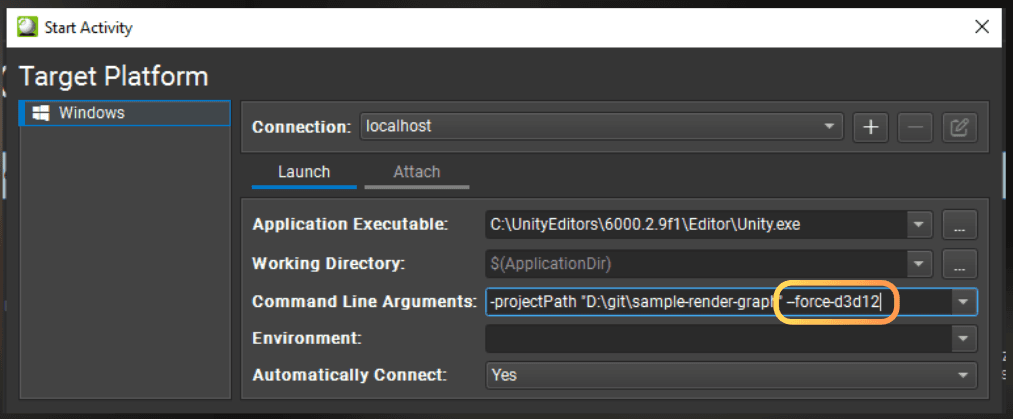
Then, in Nsight Graphics, I enter the path to the Unity Editor I use for my project.
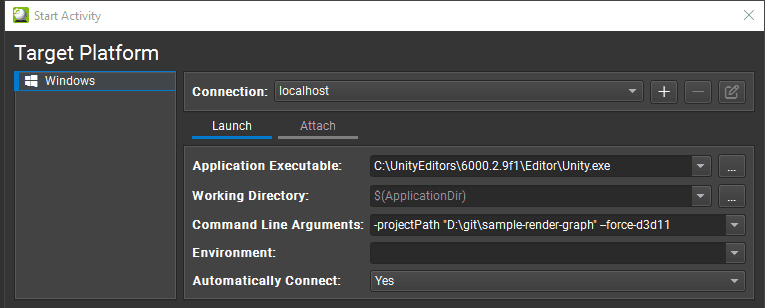
I open the project using command line arguments to skip Unity Hub. I use -projectPath to specify the project path and add -force-d3d11 to force Unity to use DirectX 11 for rendering, since DX11 is easier to debug.
To use -force-d3d11 or -force-d3d12, the project needs to have DX11 or DX12 configured as the Windows rendering API in the Project settings.
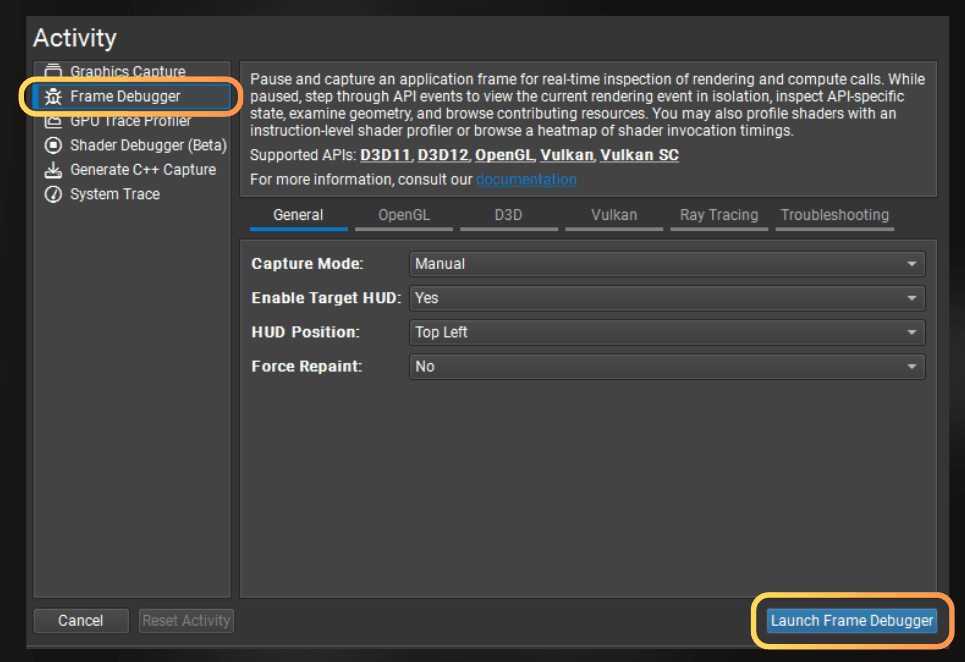
Then, in the bottom section of the window, I select Frame Debugger or GPU Trace Profiler, depending on whether I want to debug the rendering or profile it. In this case, I select Frame Debugger and press Launch Frame Debugger.
Note:
Nsight’s Frame Debugger is an Nsight activity (frame capture + native GPU inspection). Unity’s Frame Debugger is a Unity tool that shows a high-level draw sequence, but it is not a native GPU debugger.
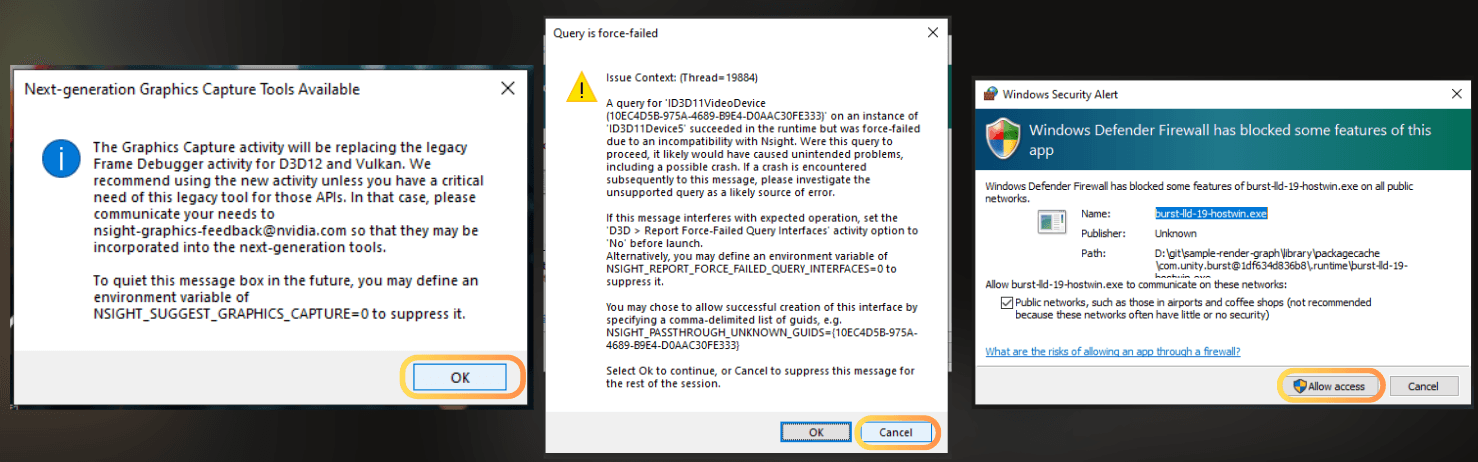
If info-windows are popping up when I try to launch the debugger, I usually skip the info windows, and press Cancel on the warnings to suppress the messages.
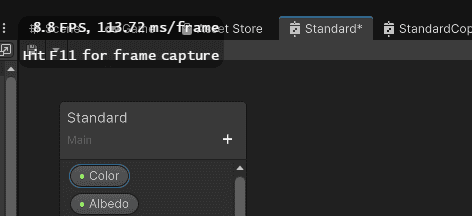
If Nsight Graphics is launched correctly in the Unity Editor, I can see the Nsight widget floating over one of the Unity tabs.
:center-px:
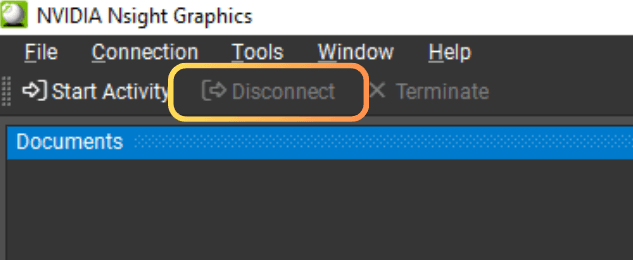
Now I need to go back to the Nsight window and reconnect to the correct Unity process. First, I disconnect from the application using this Disconnect button.
:center-px:
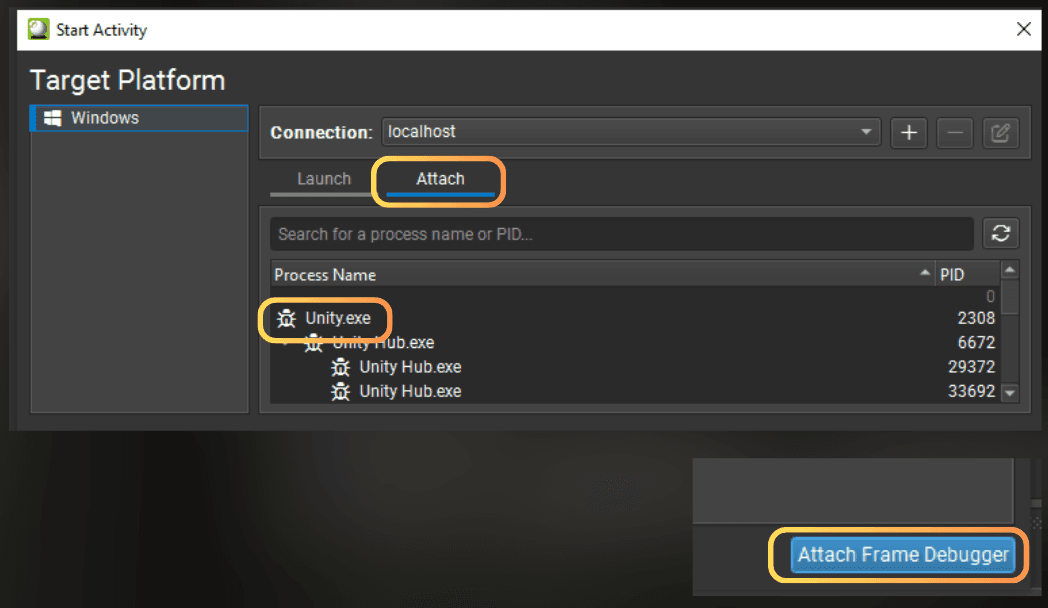
I select Start Activity. Launch starts a new app through Nsight, so Nsight can inject into it. Attach connects to an already running process. So I select the Attach tab - this searches for available processes.
Here I pick the Unity.exe process and click the Attach Frame Debugger.
Then, if the Nsight is correctly connected to the application, its window looks like this:
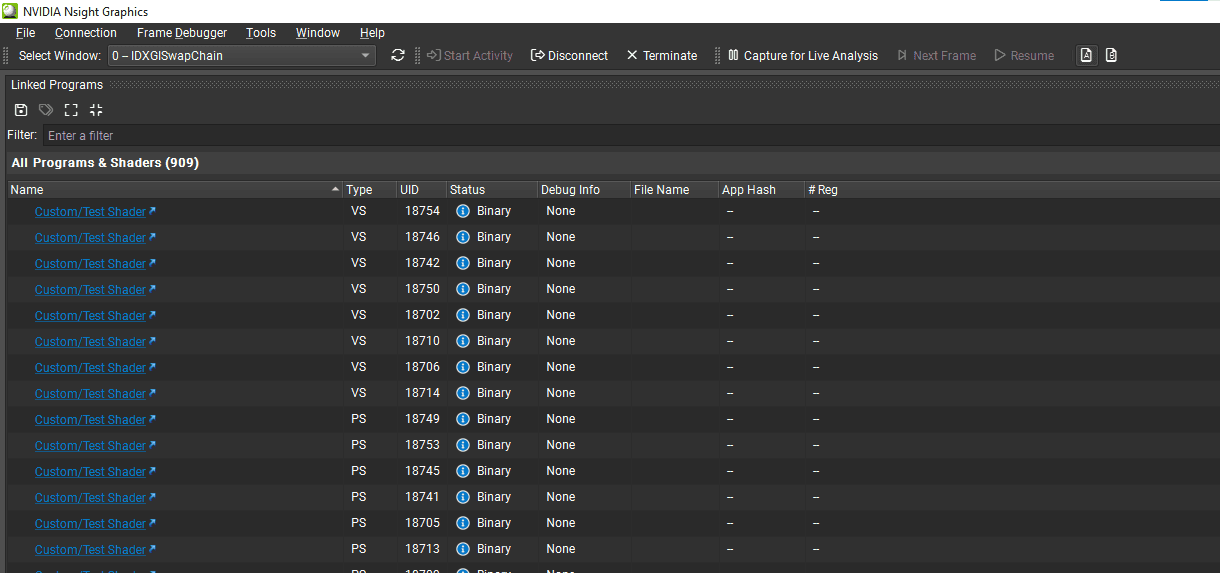
Now, how do I debug the rendering?
I open the Game view and enter Play Mode.
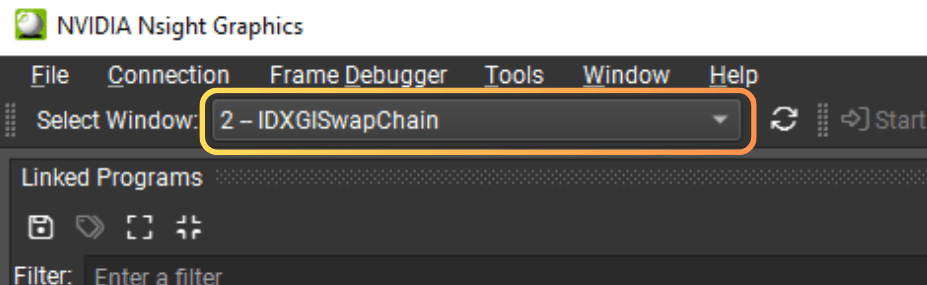
I need to ensure the Nsight widget is displayed in the game view. I use Select Window in Nsight to select the correct swap chain. Sometimes the swap chains are named. In this case, I could pick from three different swap chains to debug.
Quick glossary: Swap chain is the window surface that Unity presents frames to. In the Editor, you can have multiple swap chains, so you need to pick the one that belongs to the Game view.
:center-px:
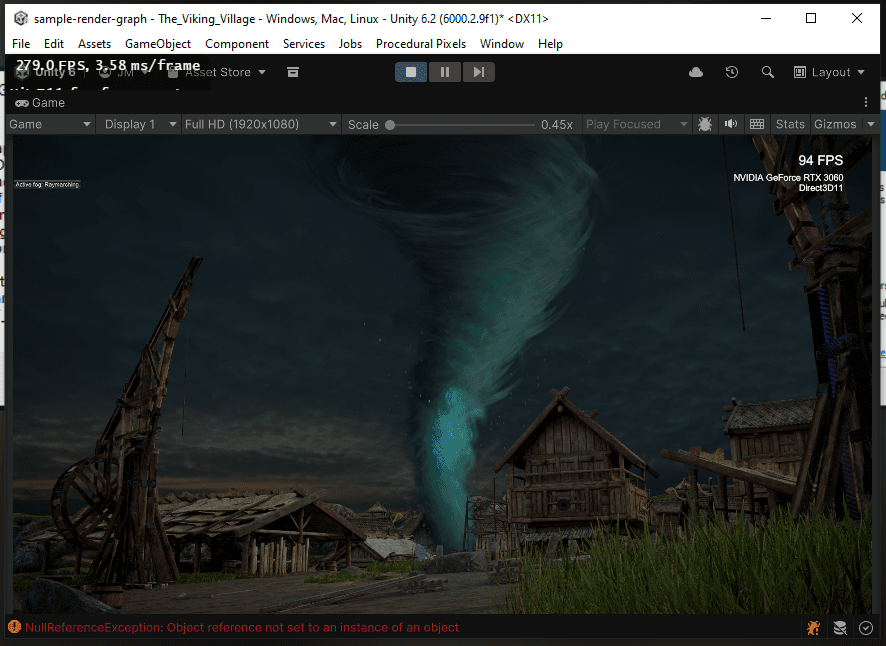
When I select the third IDXGISwapChain, the Nsight widget starts to be displayed in the Unity Editor view.
At this point, I already have Nsight injected into Unity. Now I just need to pick the right window (swap chain) and collect a capture.
I use Frame Debugger when I want to inspect draw calls, pipeline state, and API events. I use GPU Trace Profiler when I want more counters and profiling ranges.
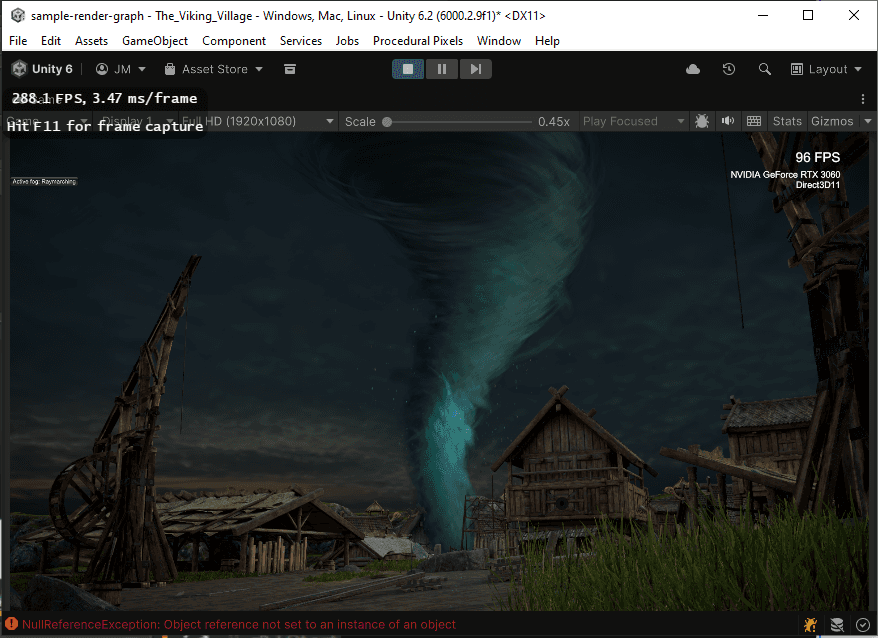
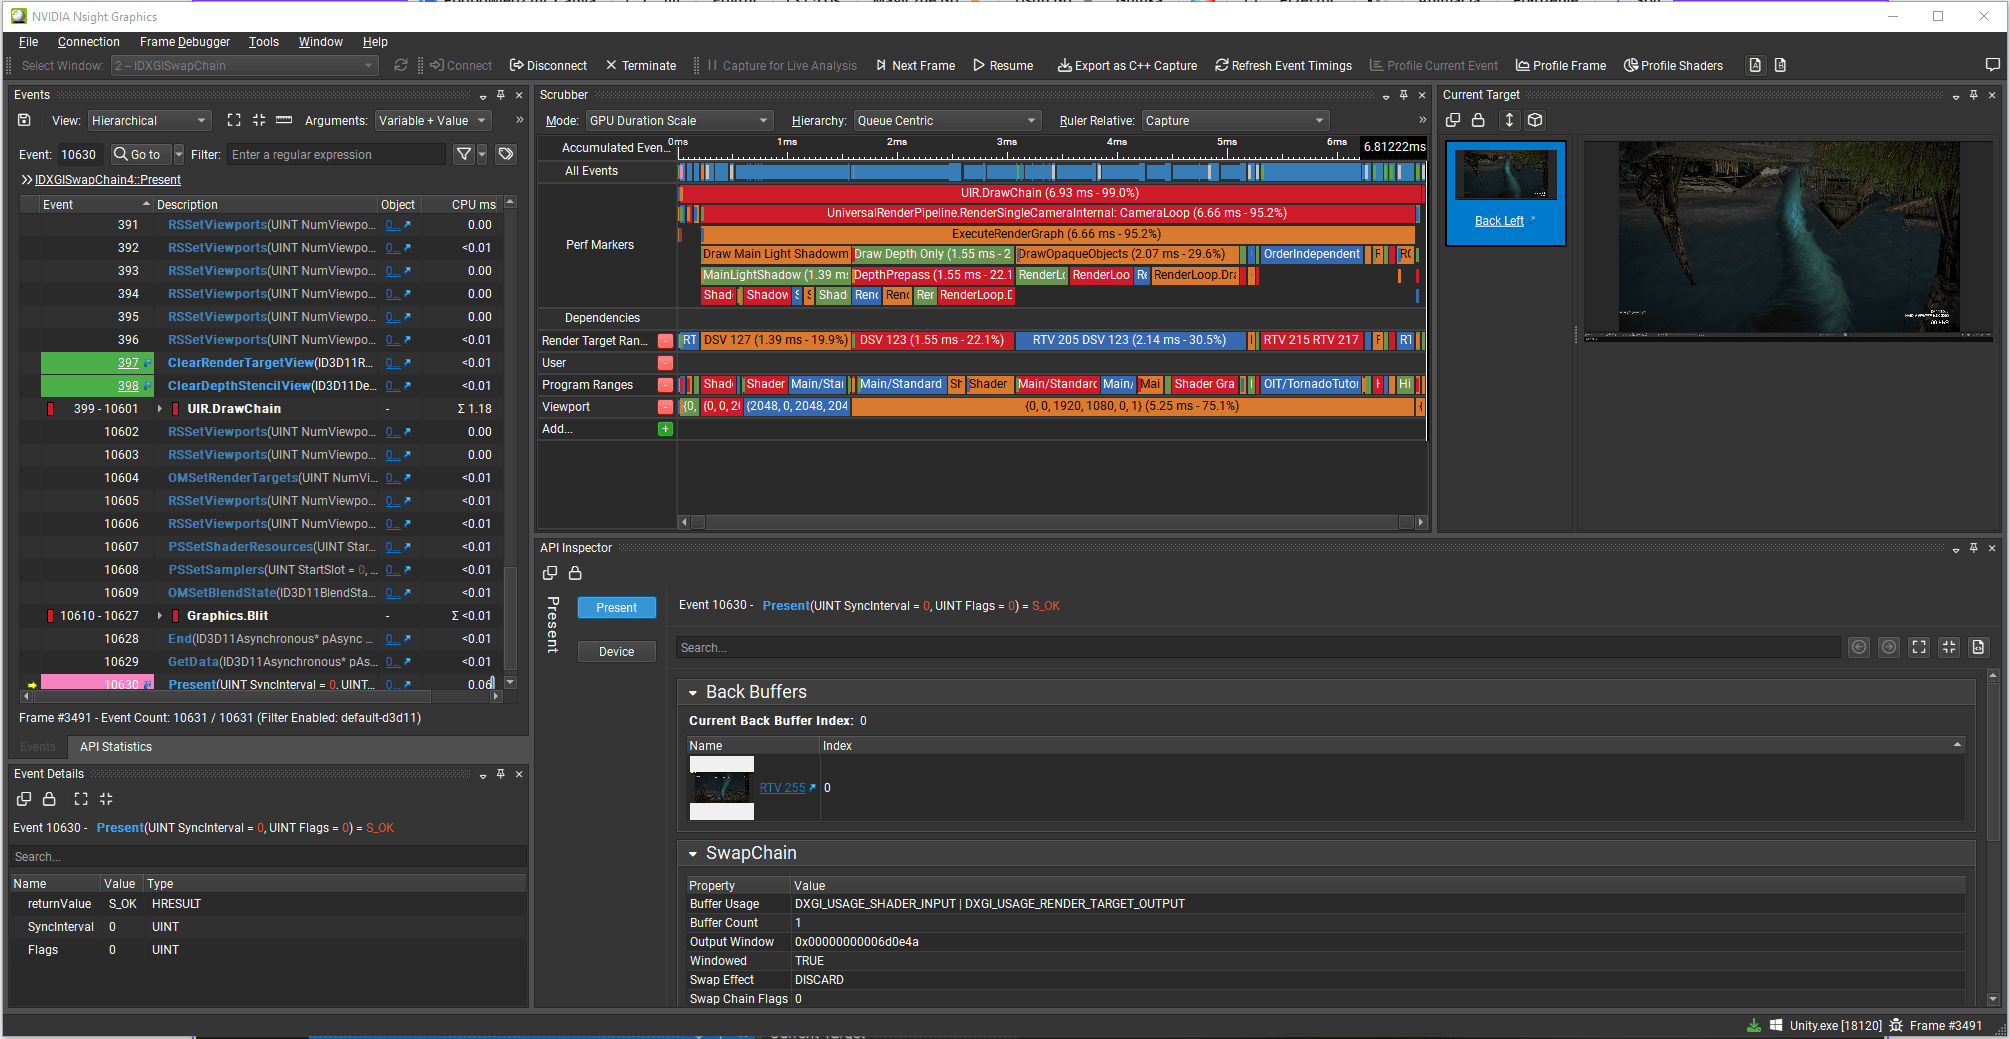
Now I press F11 to start the frame capture. This freezes the Unity Editor completely and opens Nsight Graphics frame analysis. The Unity Editor window is replaced with this one:
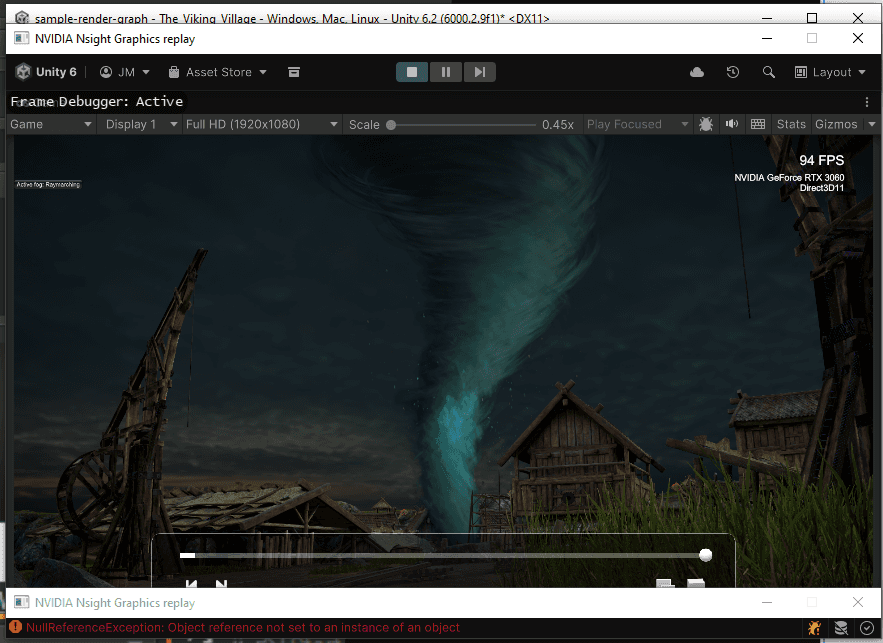
And Nsight Graphics starts to display the frame data:
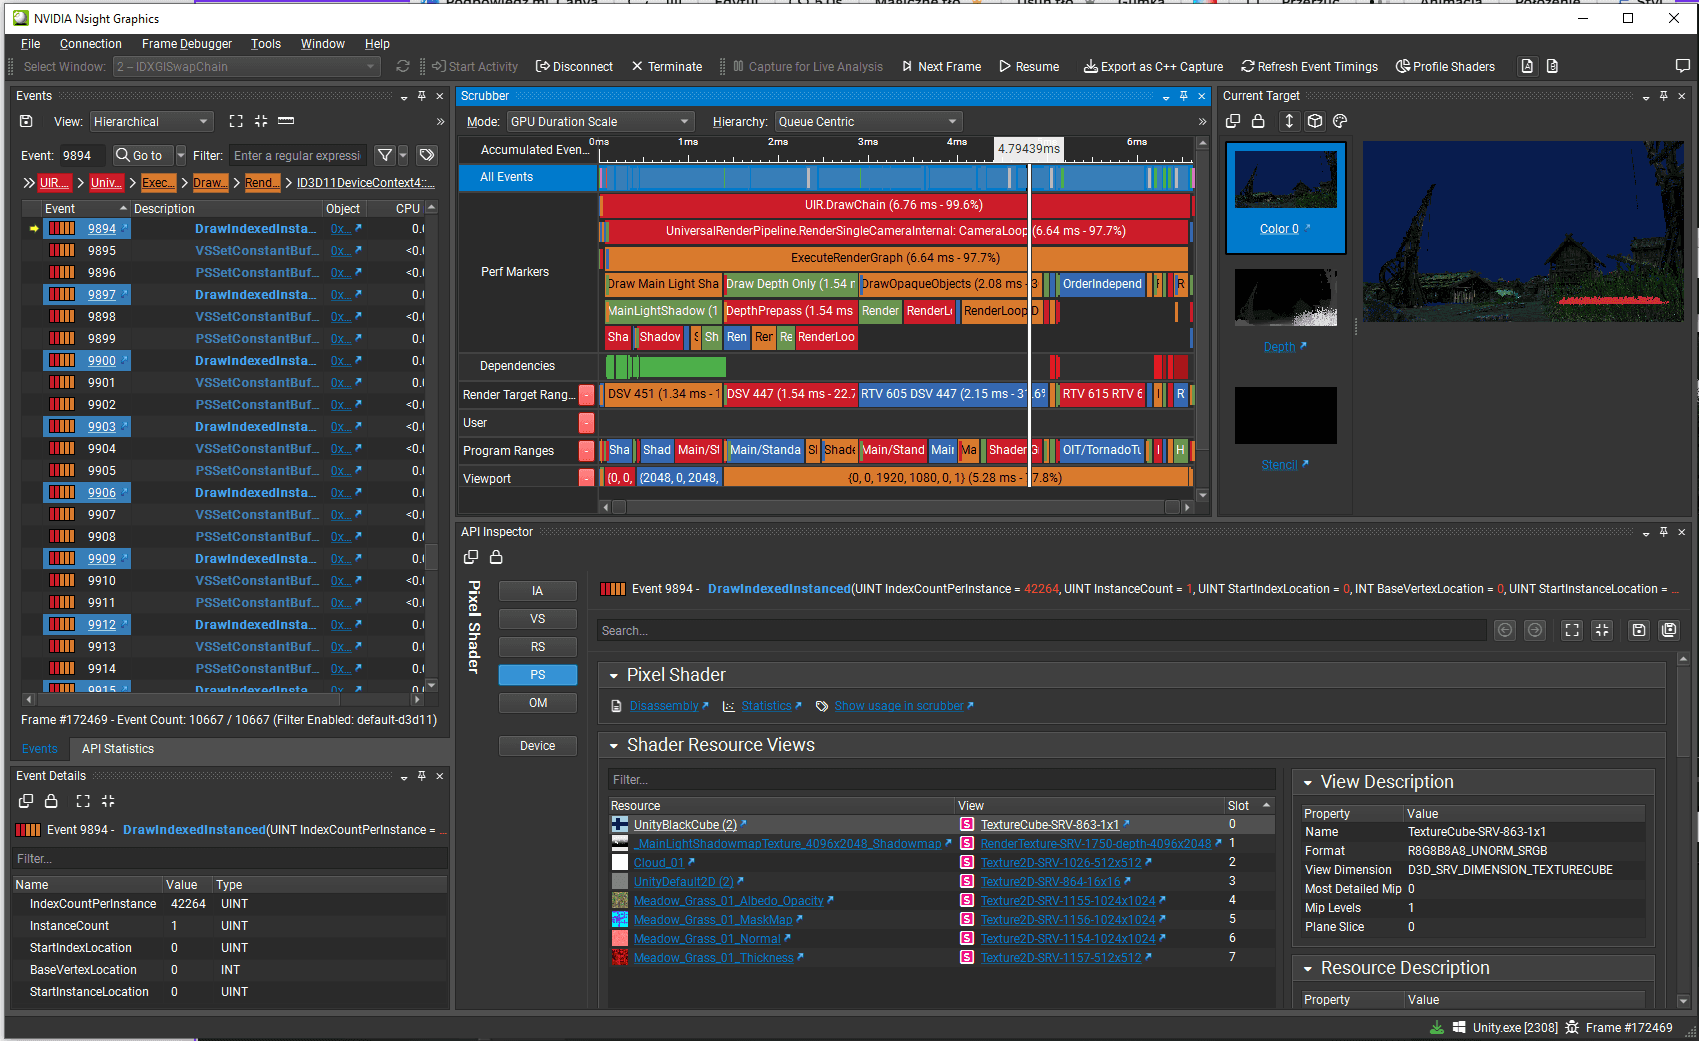
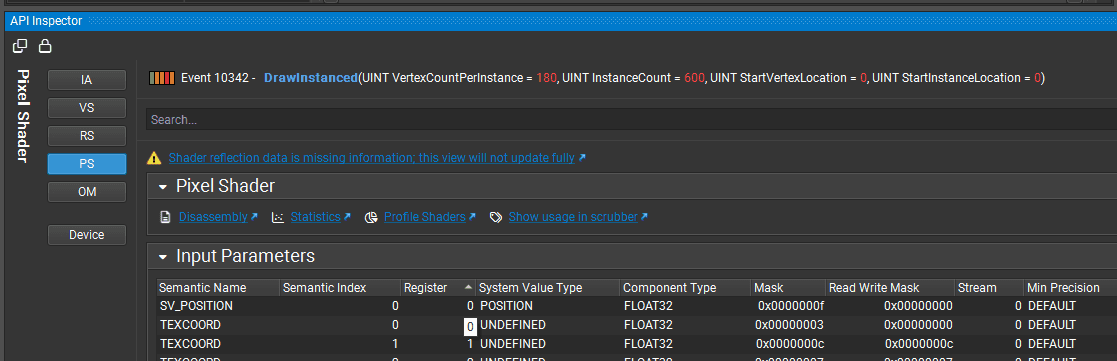
Here, I can see all draw calls invoked by the render pipeline, pipeline state, render time for each draw, and all graphics API events.
I usually inspect the frame here and then click the Resume button to get back to the Unity Editor.
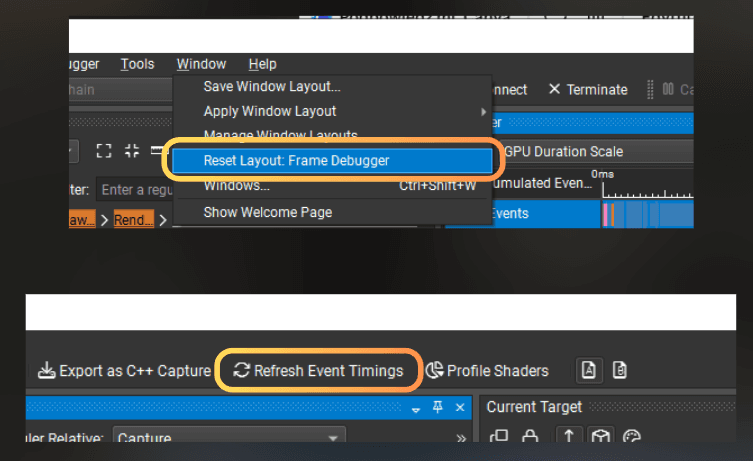
Sometimes Nsight Graphics may hitch and not show any data. In this case, I reset the window layout or use Refresh event timings. It usually starts to work correctly then.
___
Configuring the project for DX12
When working with DX12 in Unity Editor and in the build, the Frame Debugger may have some issues to properly display a GPU pipeline state and other information.
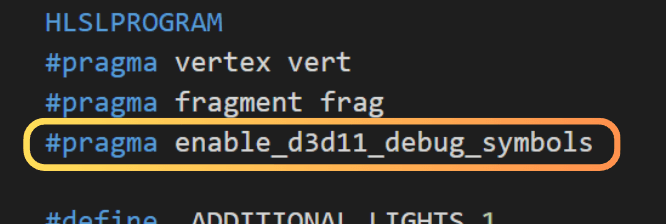
To fix this, I need to ensure that Unity generates all required debug data for the shaders. For the text shaders, I add #pragma enable_d3d11_debug_symbols to their source code.
:center-px:
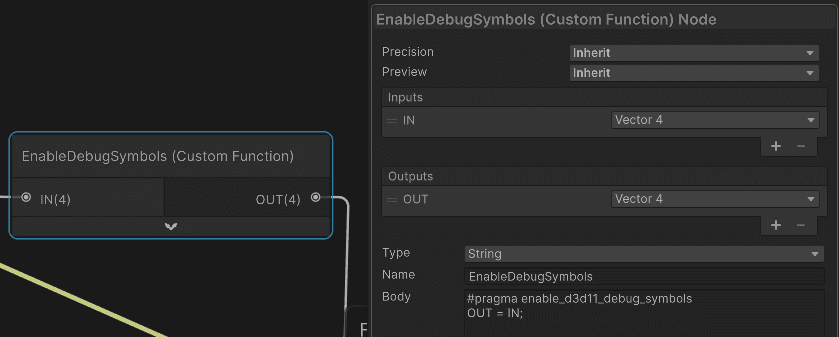
And for the graph shaders I add a custom node, that does nothing, but adds this #pragma enable_d3d11_debug_symbols. I connect this node somewhere in the graph to avoid it being stripped out by the shader graph.
By “text shaders” I mean shaders written in the .shader file format.
Safety note: editing the URP / ShaderGraph packages directly is risky. Package updates can overwrite your changes, and it’s easy to break the project.
My safe default is:
Add the pragma only to the few
.shaderfiles I actually want to debug.For Shader Graph, add a tiny custom node that injects the pragma and keep it connected in graphs that I want to inspect.
If I really want this enabled globally, I don’t edit the built-in packages directly. Instead, I use a project-local package override (a local copy of the package referenced by the project), and then I modify the shader library there so every shader gets the pragma.
___
Profiling workflows
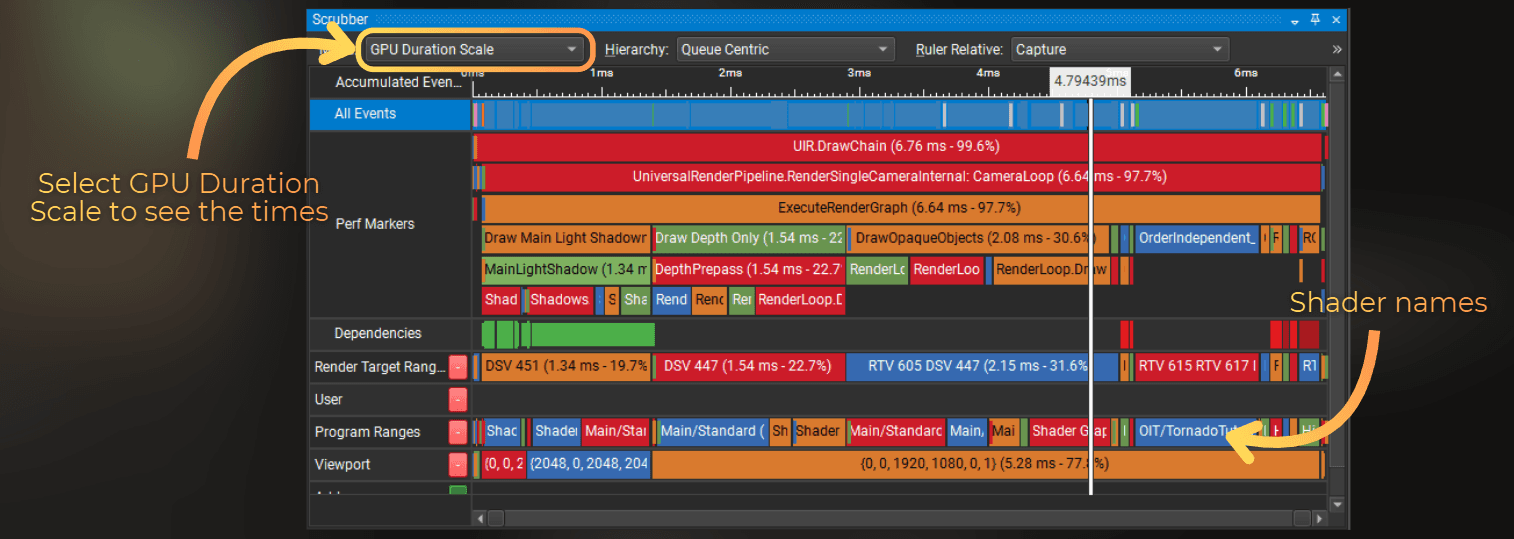
While Frame Debugger shows basic event timings, there is a better alternative for profiling. Next, I will show you how I profile DX11 and DX12.
___
Profiling DX11
To profile the project that uses the DX11 API, I use Nsight Graphics 2022.7.0.
:center-50:
Now I do the exact same steps. I connect to Unity Editor using the Frame Debugger, because the profiler in Nsight 2022.7 is integrated within the frame debugger.
So I take one capture of the rendered frame.
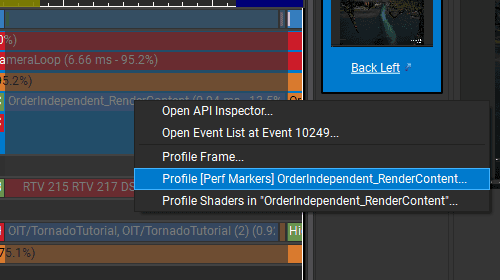
And now I have an option to profile each draw call or rendering section. For example here, I right-click on the tornado draw call and I select Profile [Perf Markers]
:center-px:
And then, the Range Profiler window opens, where I can browse different performance counters for this draw call. The bottom part of this window is the profiler section.
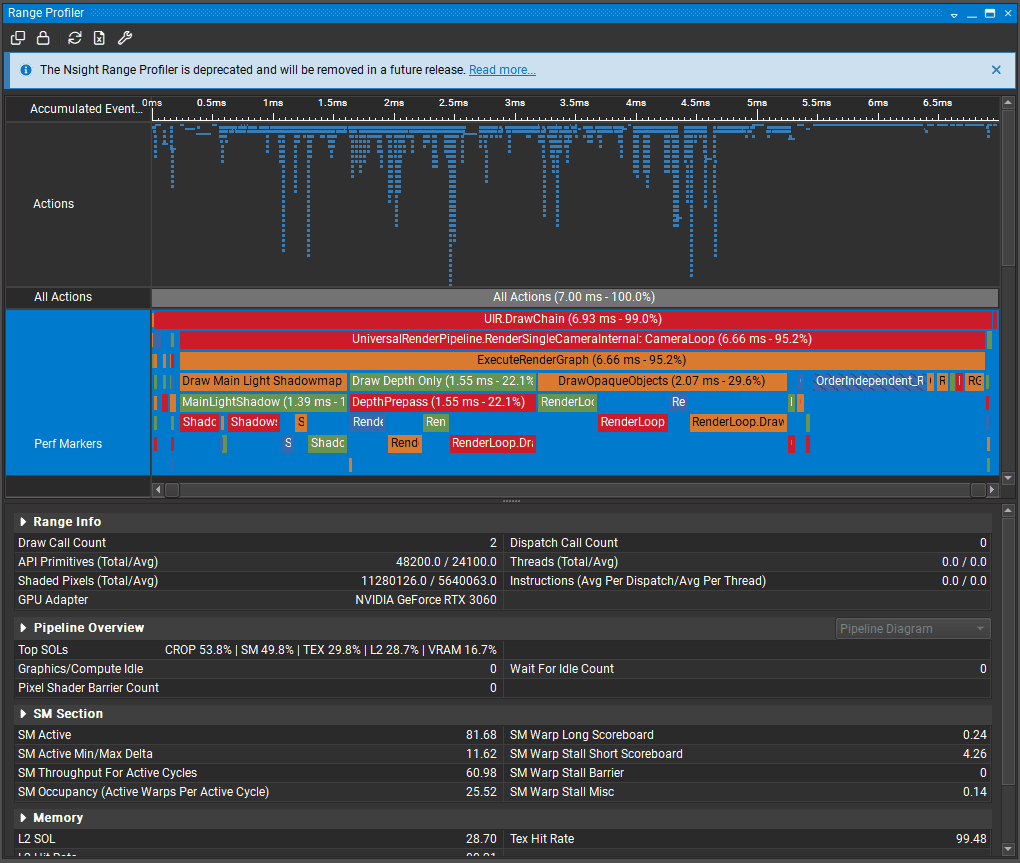
Here, each section can be expanded, and I can see a clear visual representation of the hardware pipeline with all the throughputs. I can see how many vertex shaders were executed, how many pixels were shaded, the TexL1 cache hit rate, and the L2 cache hit rate.
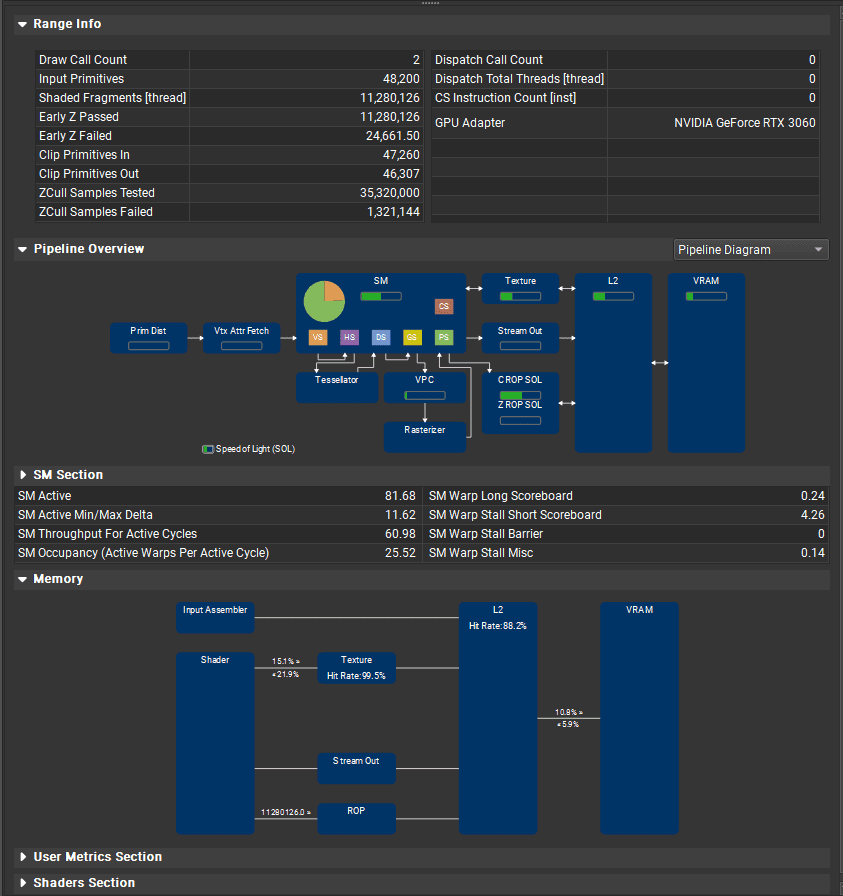
Based on this data, I can reason about the overall GPU performance and tweak the project.
For example, I return to the Unity Editor and replace the noise texture used by the tornado from a mip-mapped 128x128 to a non-mip 512x512. In the profiler window, I can see that color blending performance drops significantly, and the GPU stalls on L2 cache throughput.
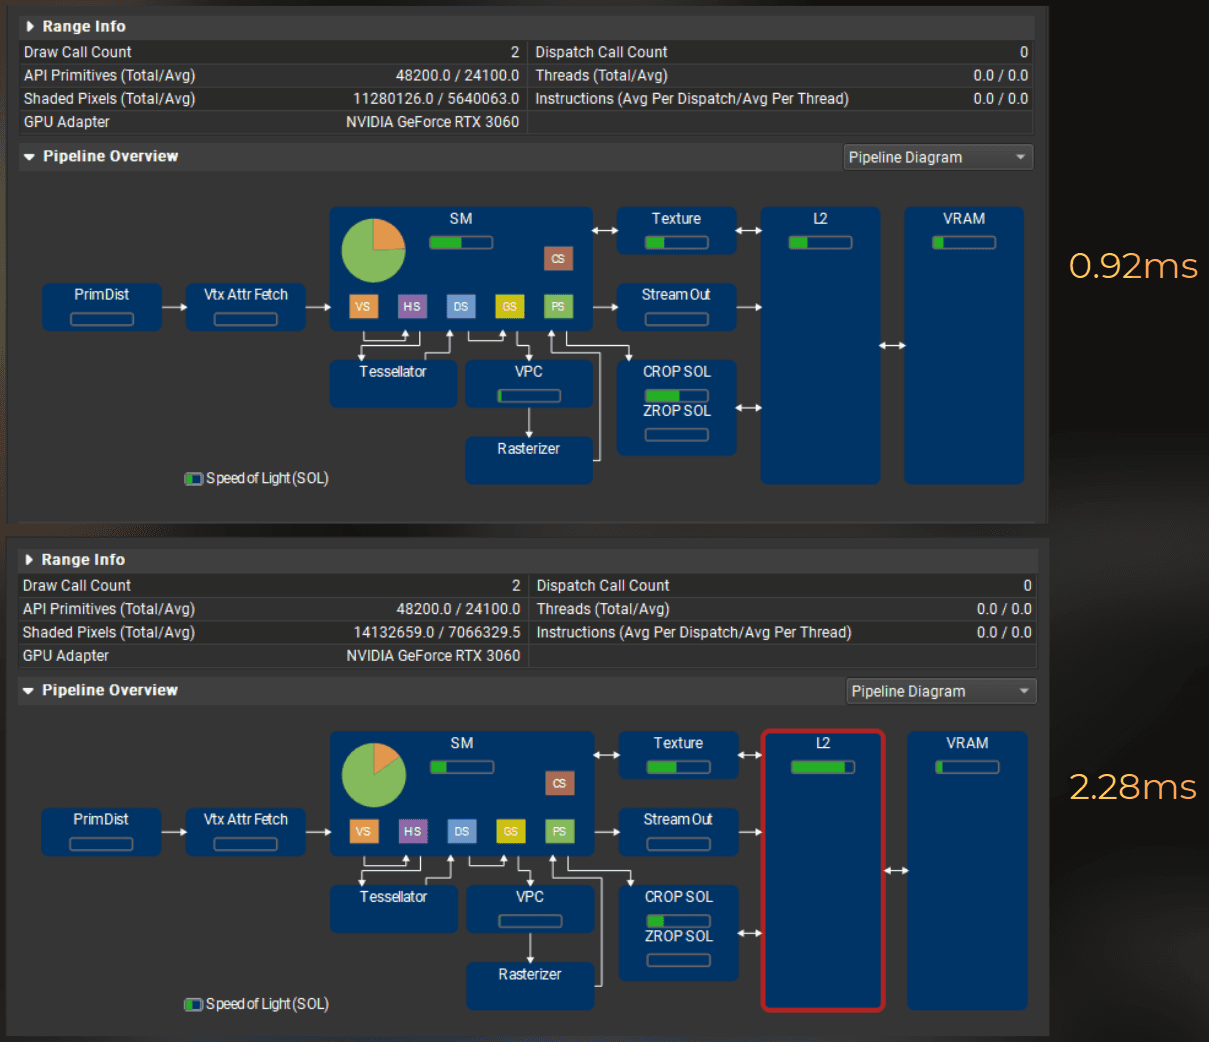
:image-description:
Difference between using mip-mapped 128x128 texture and no-mip 512x512
This is how quickly I can iterate now because I don't need to build between experiments. The results are instant.
___
Profiling DX12
Now I switch the project to use the DX12 rendering API. To profile it in Unity Editor, I use Nsight Graphics 2025.4.1.
I do the same steps, but I launch the project with forced DX12 rendering.
But instead of Frame Debugger I use GPU Trace Profiler activity. In new Nsight versions, Frame Debugger can only collect the basic timings, and the GPU Trace Profiler can collect more profiler counters, however it doesn't allow for browsing the pipeline states.
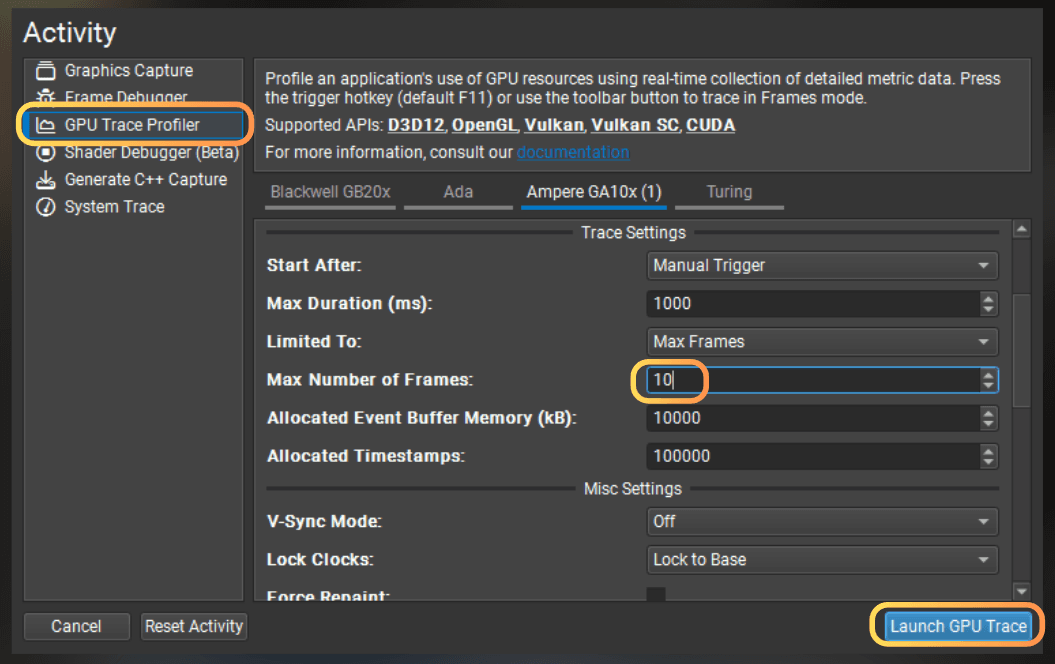
Now the Nsight Graphics widget looks slightly different.
:center-px:
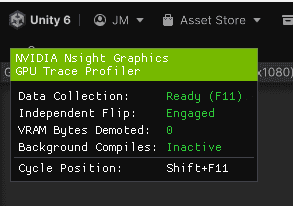
But the rule is the same, I select the swap chain in Nsight and then hit F11 to collect GPU profiling data.
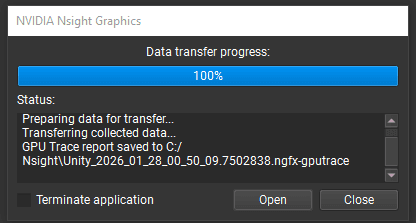
Now, Nsight doesn't stop Unity, but it displays a small window that informs me that GPU data has been collected.
:center-px:
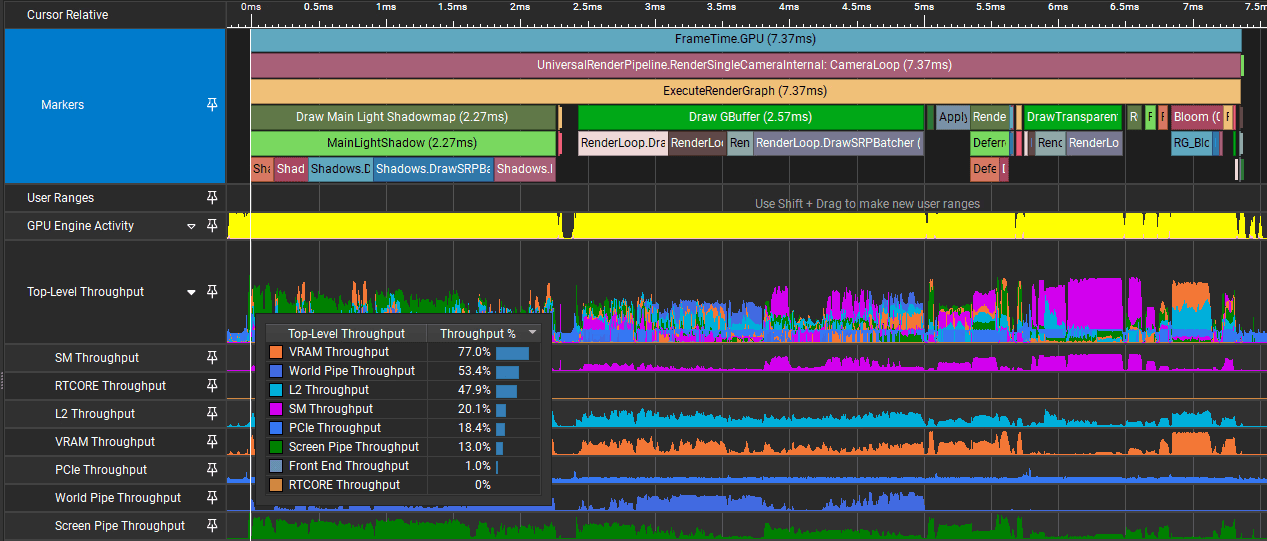
After I open the data, I can see a few frames being profiled one by one.
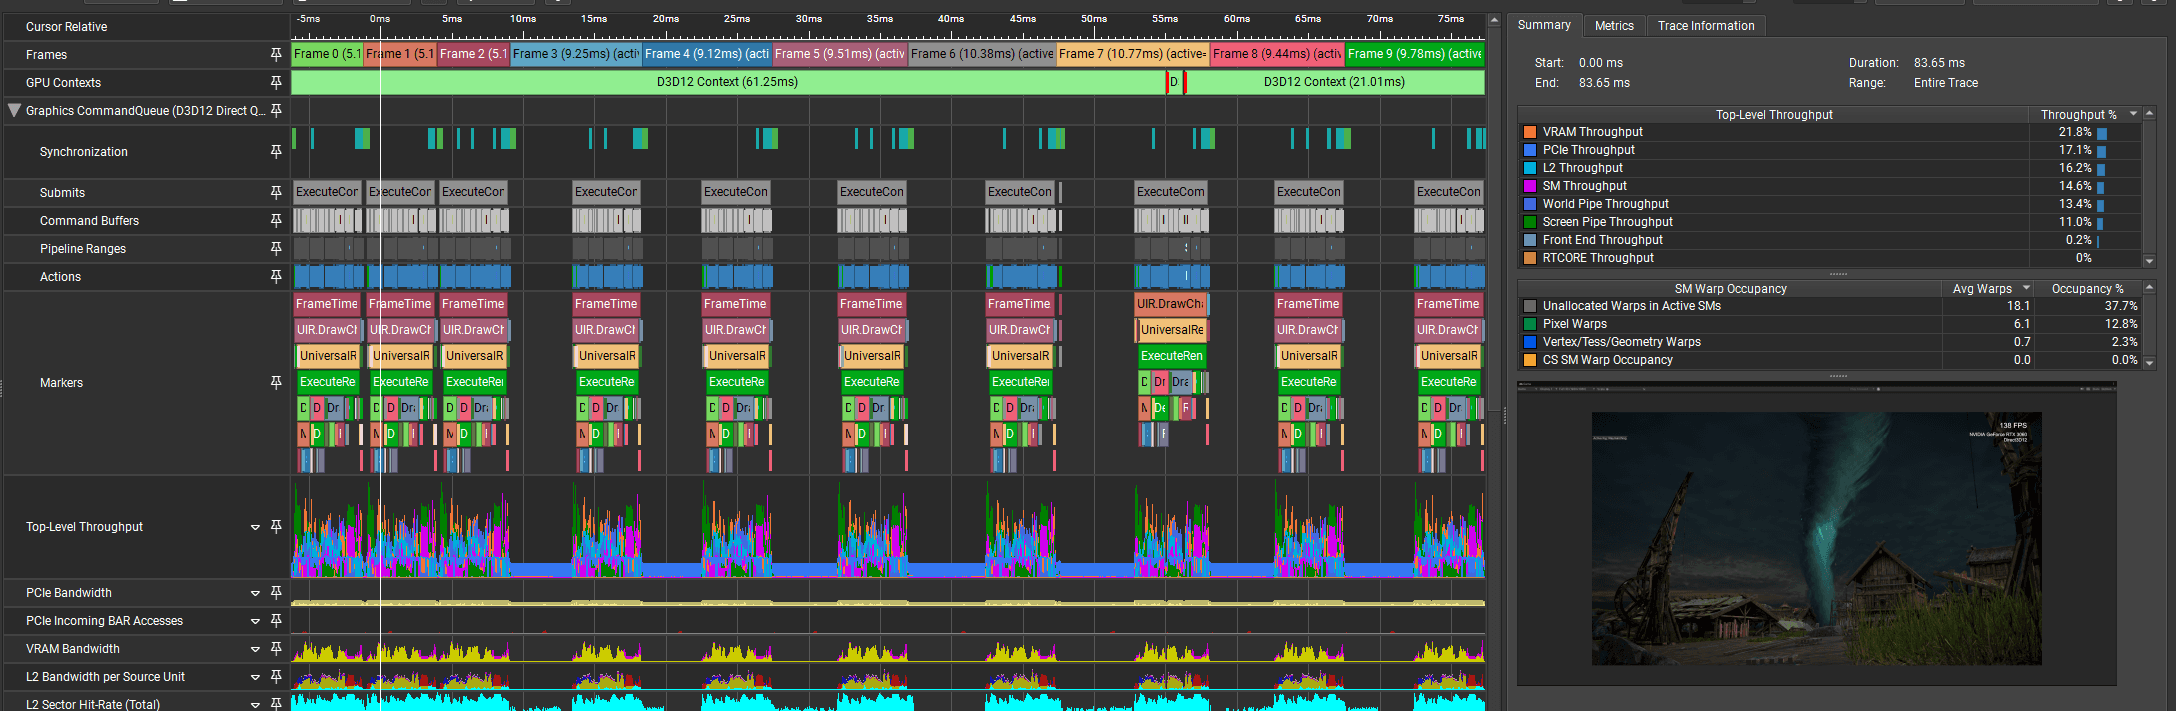
I usually zoom to the frame that wasn't interrupted by any other program:
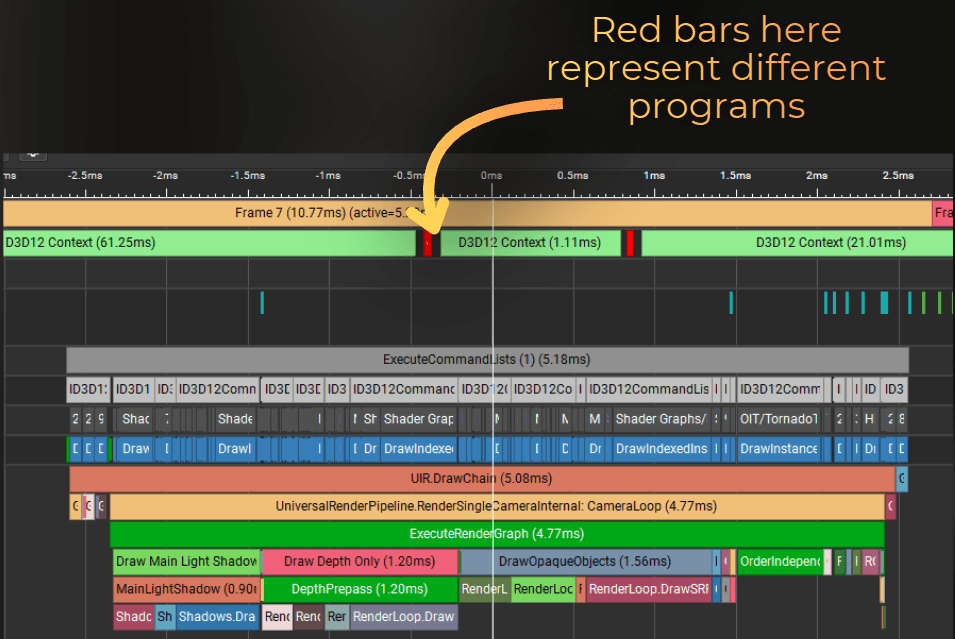
I look for the non-interrupted frame, like this.
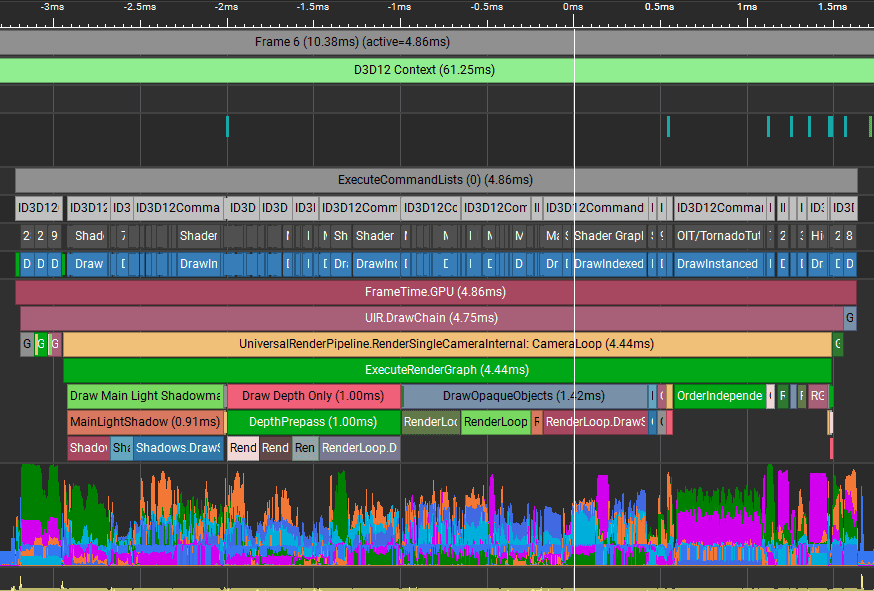
Now I can find the same draw call that rendered a tornado. After I select a draw call or a range, I get a summary of all the performance markers collected from that range.
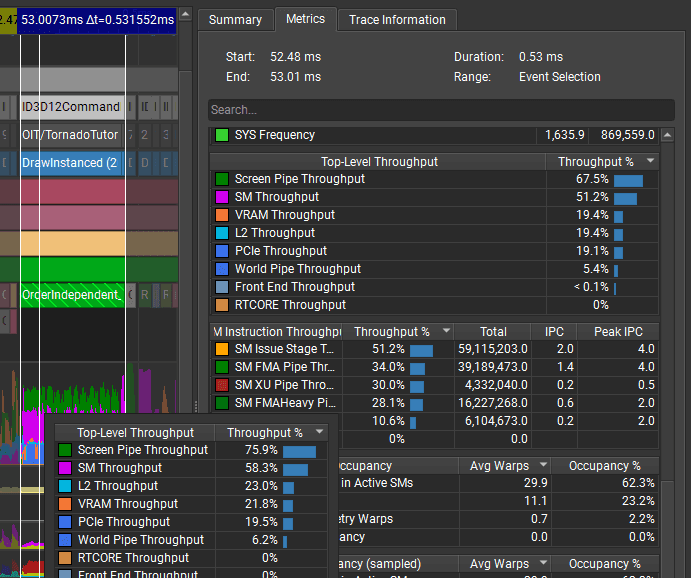
It provides about the same data as Nsight 2022.7, but there is no visual pipeline representation, only the list of counters.
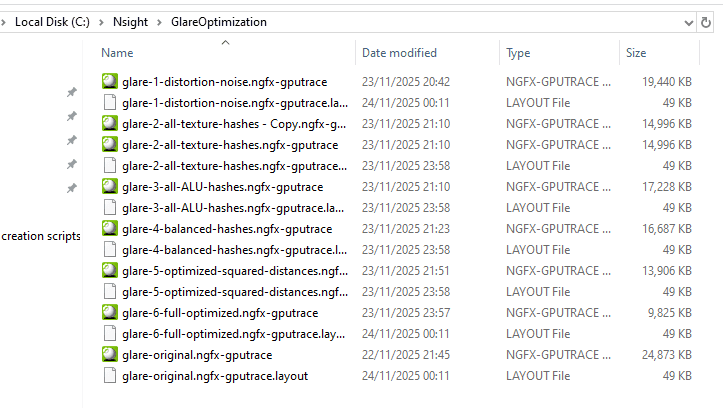
However, it is easier to compare a few measurements because the results are saved in a file, and I can rename them.
:center-px:
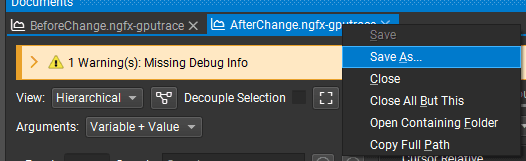
I like to keep the history of the measurements, so later I can keep track of the game performance.
Summary
Connecting a native GPU profiler to the Unity Editor saves me a lot of iteration time.
Launch Nsight + Unity Editor (my workflow):
I run Nsight Graphics as Administrator.
I kill all Unity processes.
In Nsight, I set the Unity Editor path and command-line argument
-projectPathto launch my project.I launch Frame Debugger or GPU Trace Profiler, then I attach to
Unity.exeand select the Game view swap chain.I press F11 to capture a frame.
Profiling DX11:
I use Nsight Graphics
2022.7.0and capture a frame in Frame Debugger.I right-click a draw call or a range and select
Profile [Perf Markers].
Profiling DX12:
I use a newer Nsight version (for example
2025.4.1) and launch Unity with-force-d3d12.I use GPU Trace Profiler and press F11 to collect counters, then I inspect a clean frame/range.
Remember to use native profilers with GPUs from your minimum and recommended specs. Profiling on too strong hardware will hide many performance issues.

Troubleshooting:
No performance counters: I run Nsight Graphics as Administrator.
DX11 profiling does not work: I use Nsight Graphics
2022.7.0for DX11 profiling. Newer versions dropped DX11 profiling support.Nsight widget does not show in the Game view: I use Select Window in Nsight and try other available swap chains until I find the correct one.
Capture shows no data: I reset the window layout or use Refresh event timings.
Unity does not attach correctly: I kill all Unity Hub and Unity Editor processes, then I launch Unity from Nsight again.
Nsight doesn't show GPU pipeline state for DX12: I add
#pragma enable_d3d11_debug_symbolsto the shaders I want to debug (or I use a project-local package override if I want it everywhere).Capture / attach is flaky: I disable overlays and injectors (Steam / Discord / GeForce Experience overlay, screen recorders, etc.). These tools can also inject into the process and interfere with Nsight.
I explained how to do this with Nsight Graphics, however the process is similar in any native profiler (Intel GPA, AMD Radeon GPU Profiler, PIX on Windows).
Frequently asked questions:
Q: Isn't performance in the build different?
A: Rendering in the editor is exactly the same as in the build. The GPU performance can be different only in few cases: if the editor overhead takes too much VRAM or if you use editor-only features in your game (and shaders). When profiling the editor you will also see additional overhead from the editor rendering tasks, but the tasks are clearly visible in the tools. Just ignore their times.
If you liked this article
How to properly profile your game - if you want to make your profiling results reliable: deterministic benchmarks, statistics, and how not to fool yourself when performance is sensitive.
I made this shader run 5x faster - if you want a real optimization case study: I profile a shader in Nsight and iterate until it runs ~5x faster.
If you're here from my linkedin post?
A simple thing as leaving a like will help to spread this knowledge further!
Go to my linkedin post about this topic
Want me to analyze your game?
Currently I’m building a hands-on GPU optimization course, and I want to include real production case studies from indie games.
So here’s my offer:
I’ll analyze your already released game for free and share actionable performance findings.
The only condition:
you grant me a license to reuse the case study and findings in future educational content (including the course).
If that sounds fair, drop me a DM message on LinkedIn!