Advanced
Optimization
Deep dive
Profiling
Custom occlusion culling - faster than Unity
20 min

In this article, I will show you how I implemented occlusion culling in Unity that runs faster than baked occlusion and the GPU Resident Drawer in my project.
This occlusion culling saves main-thread CPU time, render-thread CPU time, and GPU render time by running a ~0.1ms task on a separate thread each frame.
Enabling this occlusion saves more time than it takes to process it. Here is how I did it.

Step by step:
Prepare a deterministic benchmark - collect GPU and CPU timings.
Profile the project
without occlusion culling.
with baked occlusion.
with GPU Resident Drawer.
Build a custom occlusion culling designed for this specific project.
Requirements
Algorithm idea
Implementation
A few optimization steps
Profit 💸
Benchmarks and comparison with Unity solutions.
___
Prepare benchmark
First, I need to prepare a deterministic benchmark to profile the main-thread, render-thread, and GPU render times for each scenario.
I created a spline that goes through the level and made the camera move along. The camera renders 1200 frames over this spline, each frame is always in the same position. At the end, the camera jumps to a predefined position and stays there so that I can sample the GPU trace from the same frame for all scenarios.
The benchmark contains 1200 frames, so the Unity Profiler can fully record it. I built the project and profiled it using the Unity Profiler and NVIDIA Nsight Graphics.
___
Benchmark results
Profiling on:
i5-10400F, RTX 3060 12GB, 64GB RAM,
Resolution: 1440p
Build and features:
Windows build,
Backend: Il2CPP release config,
Development build,
Dcript debugging disabled,
Deep profiling disabled.
___
No occlusion culling - benchmark
Those are the reference times. Now I will compare the baked occlusion and GPU Resident Drawer to these results.
GPU frame time: 6.38ms
MainLightShadow: 1.62ms
DepthPrepass: 1.34ms
DrawOpaqueObjects: 1.98ms
___
Baked occlusion culling - benchmark
Baked occlusion culling in Unity converts scene occluders into voxels that are later used to determine the visibility of other objects.
I baked the occlusion culling using those settings, as it bakes quickly and seems to work fine in the editor playmode.
:center-px:
Unfortunately, I couldn’t get it to work in the build. It only worked in the editor.
This is probably a critical bug in the current Unity version.
So I will compare it in the editor against the “release” runtime configuration with safety checks disabled. This is a comparison with occlusion disabled.
:center-px:
GPU frame time: 6.38ms -> 6.22ms (-0.16ms)
MainLightShadow: 1.62ms -> 1.67ms (+0.05ms)
DepthPrepass: 1.34ms -> 1.24ms (-0.10ms)
DrawOpaqueObjects: 1.98ms -> 1.89ms (-0.09ms)
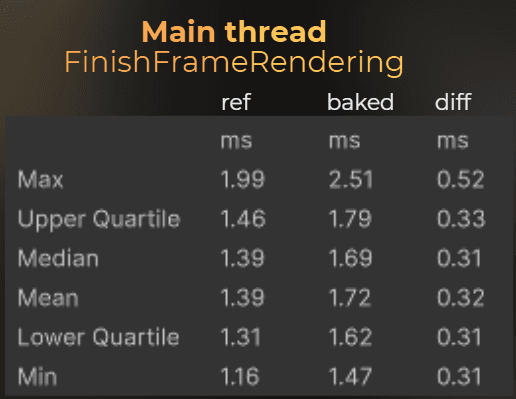
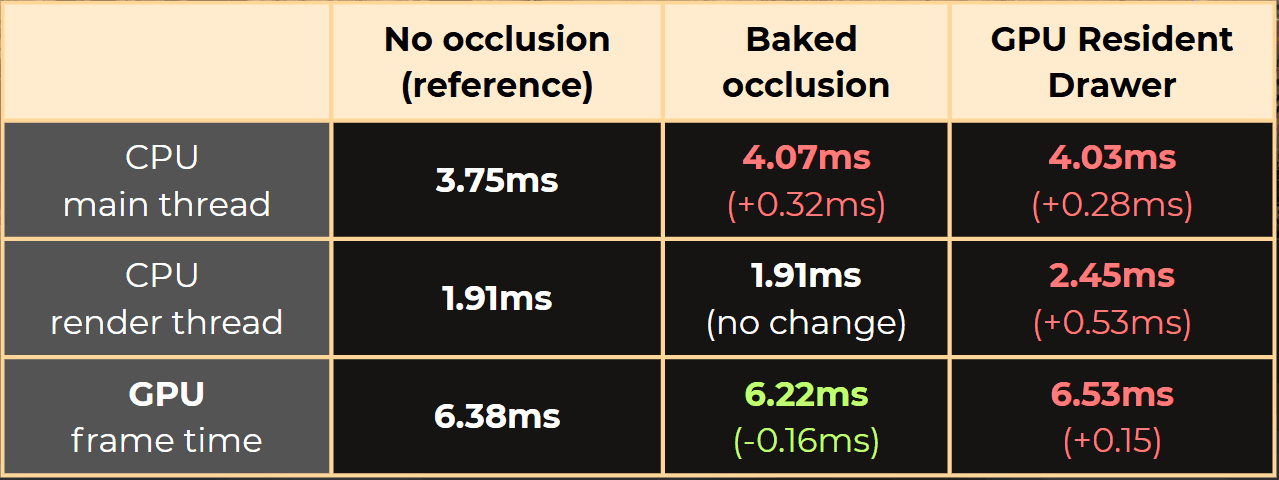
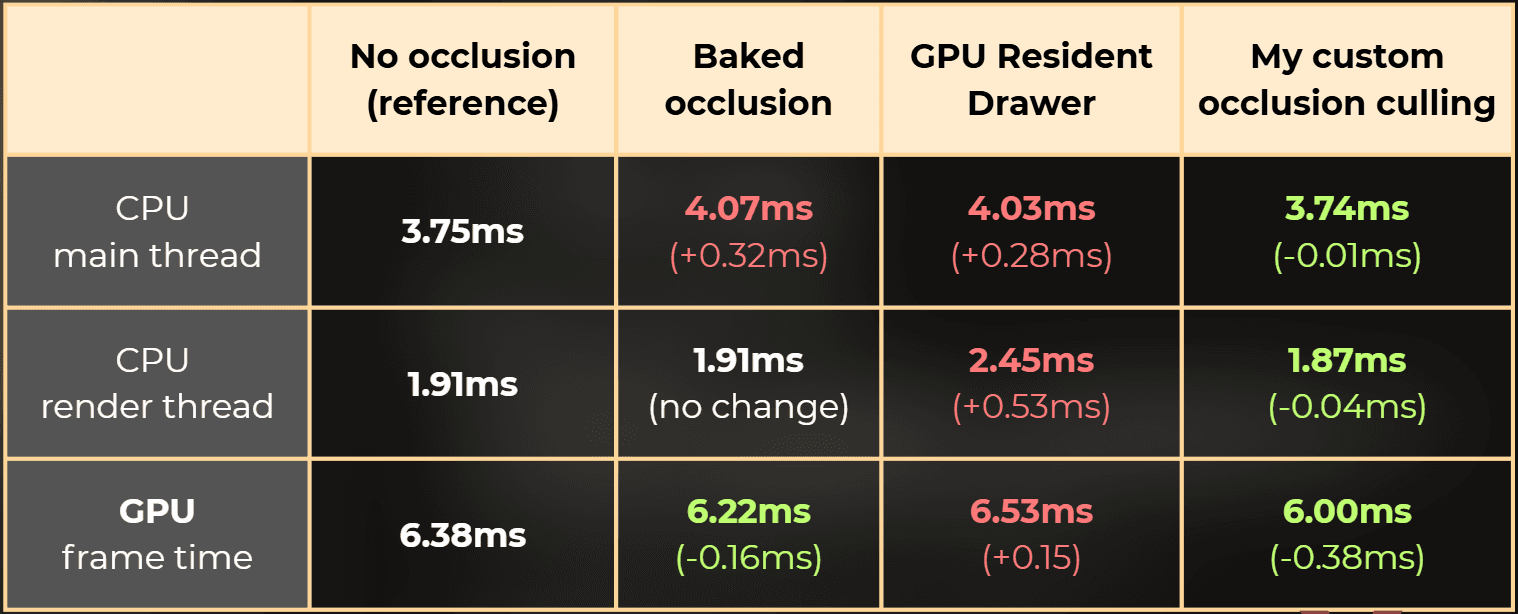
Unity's baked occlusion culling summary:
Baked occlusion culling added 0.32ms on a CPU main thread on average.
CPU render thread time didn’t change.
GPU frame time reduced from 6.38ms to 6.22ms.
___
GPU Resident Drawer - benchmark
GPU Resident Drawer is a relatively new Unity feature that uses a different rendering backend. It performs culling on the GPU and uses indirect instanced rendering to render objects.
I enabled GPU Resident Drawer in the render pipeline settings.
:center-px:
I profiled it in the build. This is the difference between the main thread and the disabled occlusion.
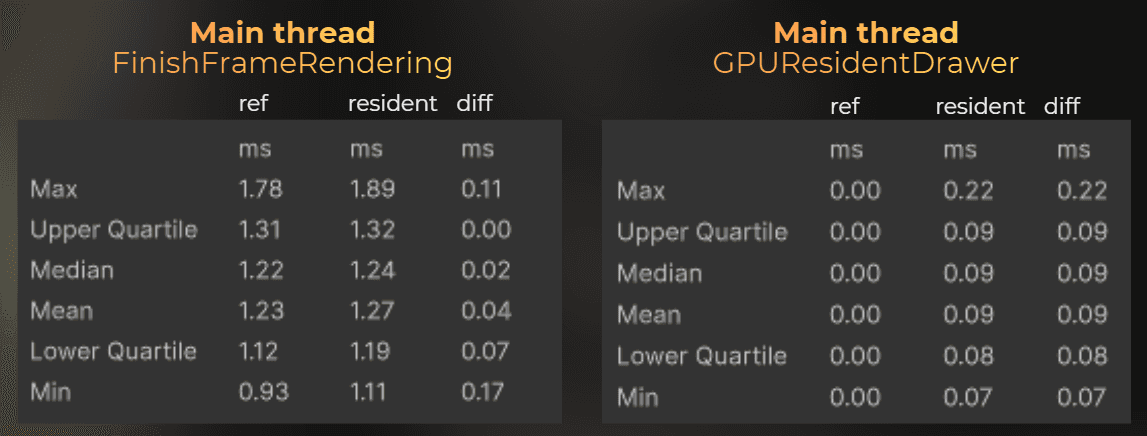
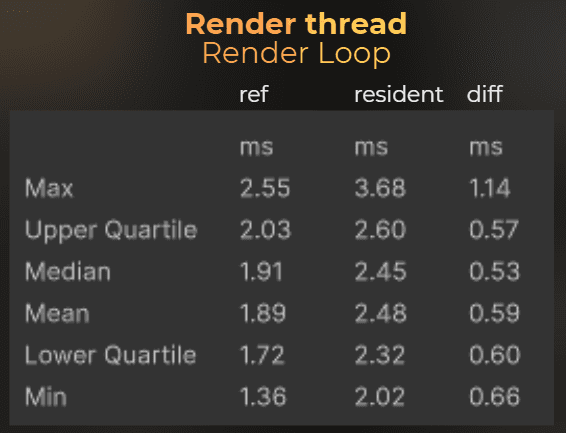
And now, render thread, compared to the disabled occlusion.
:center-px:
GPU frame time: 6.38ms -> 6.53ms (+0.15ms)
MainLightShadow: 1.62ms -> 1.56ms (-0.06ms)
DepthPrepass: 1.34ms -> 1.26ms (-0.08ms)
DrawOpaqueObjects: 1.98ms -> 2.14ms (+0.16ms)
GPU Resident Drawer compute shaders: 0.00ms -> 0.16ms (+0.16ms)
Summary:
GPU Resident Drawer slows rendering on both the CPU and GPU.
Average CPU main thread time increased by 0.28ms from 3.75ms to 4.03ms.
Average CPU render thread time increased by 0.53ms from 1.91ms to 2.45ms.
Average GPU time increased by 0.15ms from 6.38ms to 6.53ms.
But it reduced draw call count from 2155 to 689! Anyway, players care about frame time, not draw call count.
___
Custom occlusion culling
In the benchmarks, you can see that for the fastest CPU time, I should not use any culling. But I can trade some CPU time for lower GPU time by using baked occlusion culling.
My goal here is to implement custom occlusion culling that improves CPU and GPU time.
But how?
How can I improve CPU and GPU performance when occlusion culling requires occlusion computation?

The idea is simple. The CPU needs to process all renderers each frame to render them. If occlusion computation takes less time than it saves for other renderer-related tasks, it will save time.
I just need to create an occlusion algorithm that runs fast enough to save time during frustum culling, object filtering, and sorting.
___
The idea!
Let’s assume I create a first-person game where the player walks on the ground. This is a realistic expectation for a game. In the end, I want the occlusion to work for my game, not every game.
Then I want the occlusion to be static. Only static objects can be occluders, and only static objects can be occluded. I want this algorithm to work in the simplest case, so I can later expand it with dynamic objects.
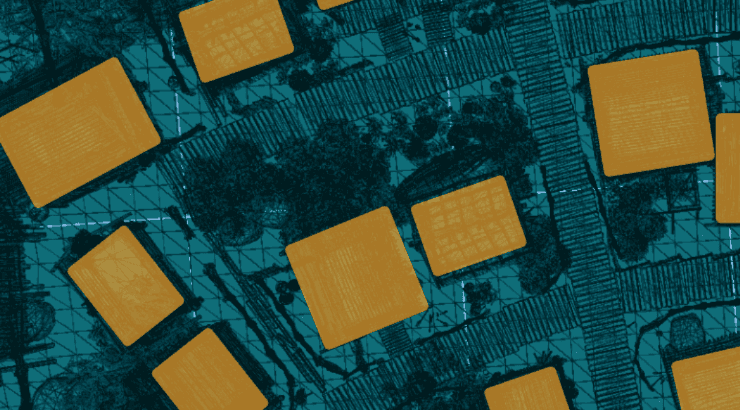
The player walks into this village. It contains big buildings and smaller props.

I can manually place a large box inside the buildings. Those boxes will represent the occluders.

Then, I can iterate through each renderer in the scene and calculate its center and radius. This will create a bounding sphere for each small renderer. Here I marked just a few.

I plan to ray-cast or cone-cast from each renderer to the camera position to check whether it is visible through the occluders.
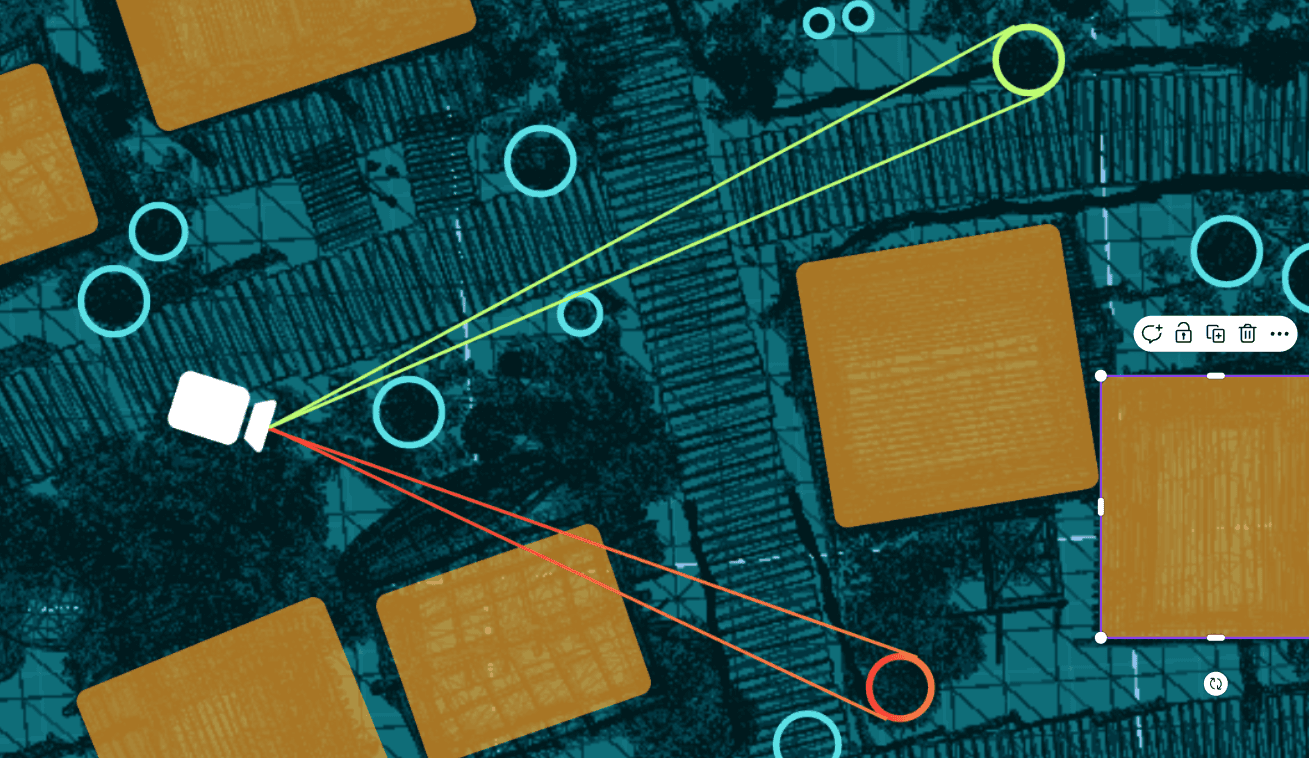
So I will test every renderer with every occluder.
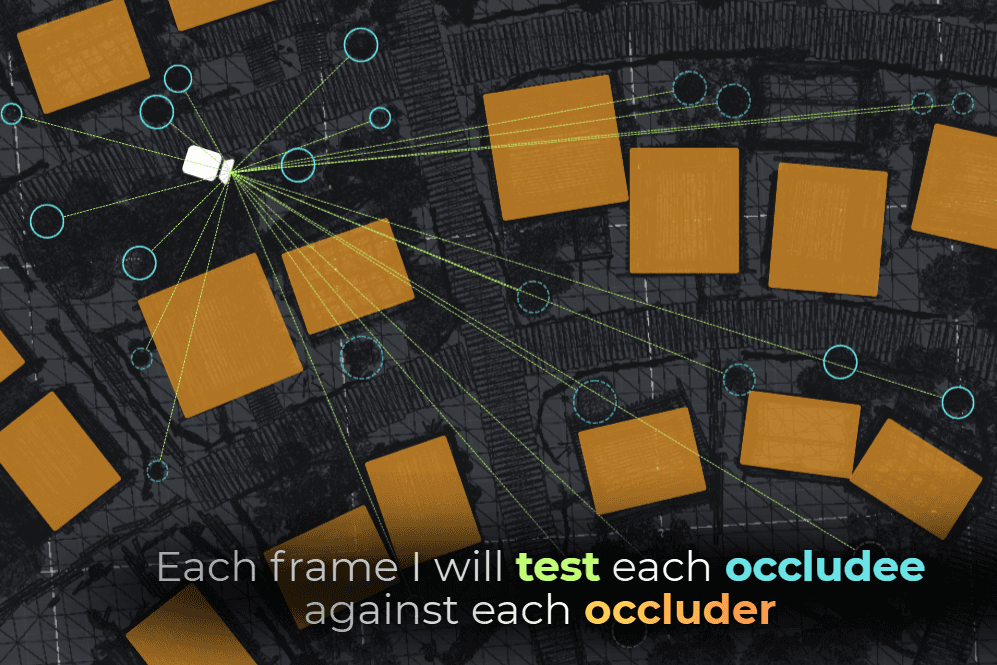
Is it stupid? Yes.
Can it be fast? Also yes.
___
Implementation
Implementation plan:
Mark large occluders with custom
BoxOccluder.Collect small renderers and build lightweight occludee data.
Implement fast cone-tracing..
Run per-frame occlusion tests and build a set of visible IDs.
Enable and disable renderers based on visibility.
Ok! Let’s start the implementation!
___
1. Implementing the occluder.
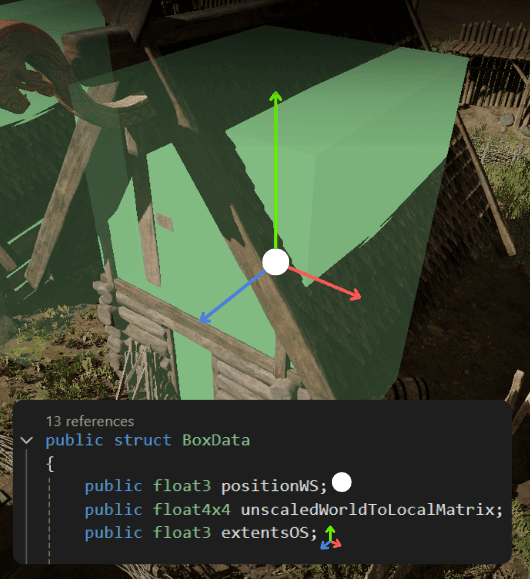
I started by implementing the BoxOccluder component. This marks the large occluders in the scene. Internally, it will be just a struct.
I keep these structs unmanaged so later I could use Burst to compile the performance-critical parts of the occlusion into fast native code.
Then I went through the scene and placed all the occluders.
:center-px:
At the start of the scene, I collect all the static occluders into an unsafe list. I use unsafe collections because they will be used in a performance-critical code, so I want to have an option to compile this code into native assembly with the Burst compiler.
And this is how I collect the occluders:
Now, this part is done:
___
2. Detecting small renderers
Then I wanted to detect all the small renderers in the scene.
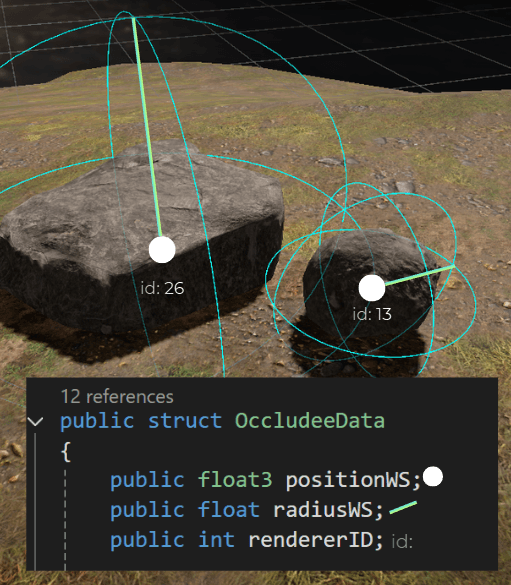
I decided to store a list of renderers and a separate list of their properties. The occludee properties are unsafe and unmanaged, so I could later use them in high-performance code.
Both lists are synced, so occludeesPtr->ElementAt(i) corresponds to the properties of occludeeRenderers[i].
And occludee data is just a bounding sphere with the renderer ID:
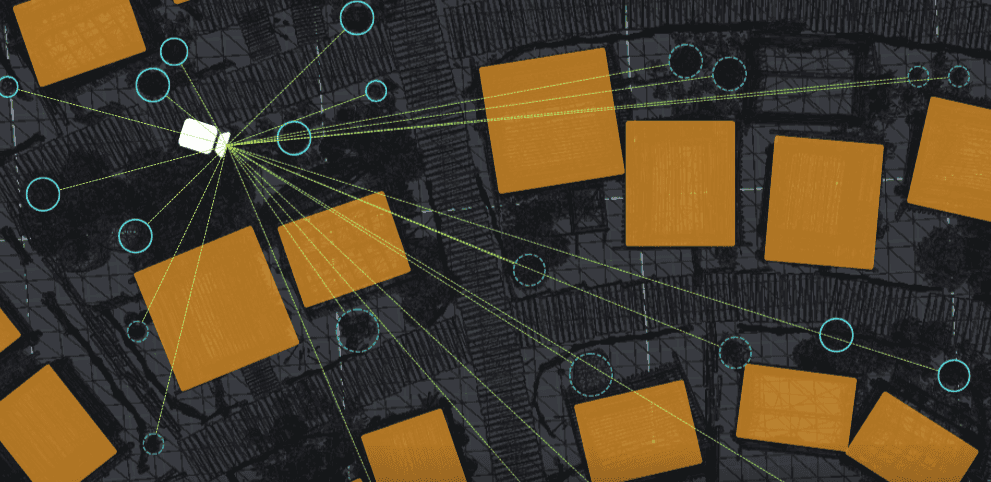
This is how it looks, visualized:
:center-px:
Then I wrote the code to iterate through each renderer, calculated every bounding sphere, and created the data:
Now I have this process completed:
___
3. Cone-tracing
Now I need a way to check whether a sphere is behind the box. I decided to use custom raycast math rather than built-in physics, since I need to be 100% sure it runs as fast as possible. I used the boxIntersection function from https://iquilezles.org/articles/intersectors/, and modified it.
The original function returns the distance to the entry and exit hits, and the normal vector. However, I need the distance to the first hit, so I optimized it even further.
I used Shadertoy to check its behavior, so I’m 100% sure that box-raycasting works correctly. I did that because I was unsure whether the argument boxSize stores the full size of the box. In this case, boxSize doesn’t store the box size, but the boxExtents, which is half the box's size.
Good to check such details before using snippets found online.
Then I needed to modify the box ray-casting algorithm to use cone casting instead. I couldn’t find any easy box-cone intersection algorithm, so I figured out this one on my own.
This can create false-positive visibility, but it never produces false-positive occlusion.
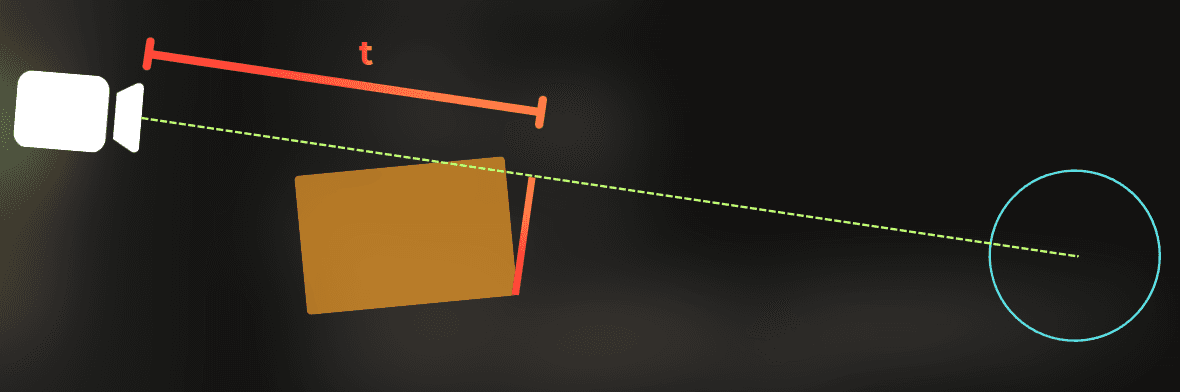
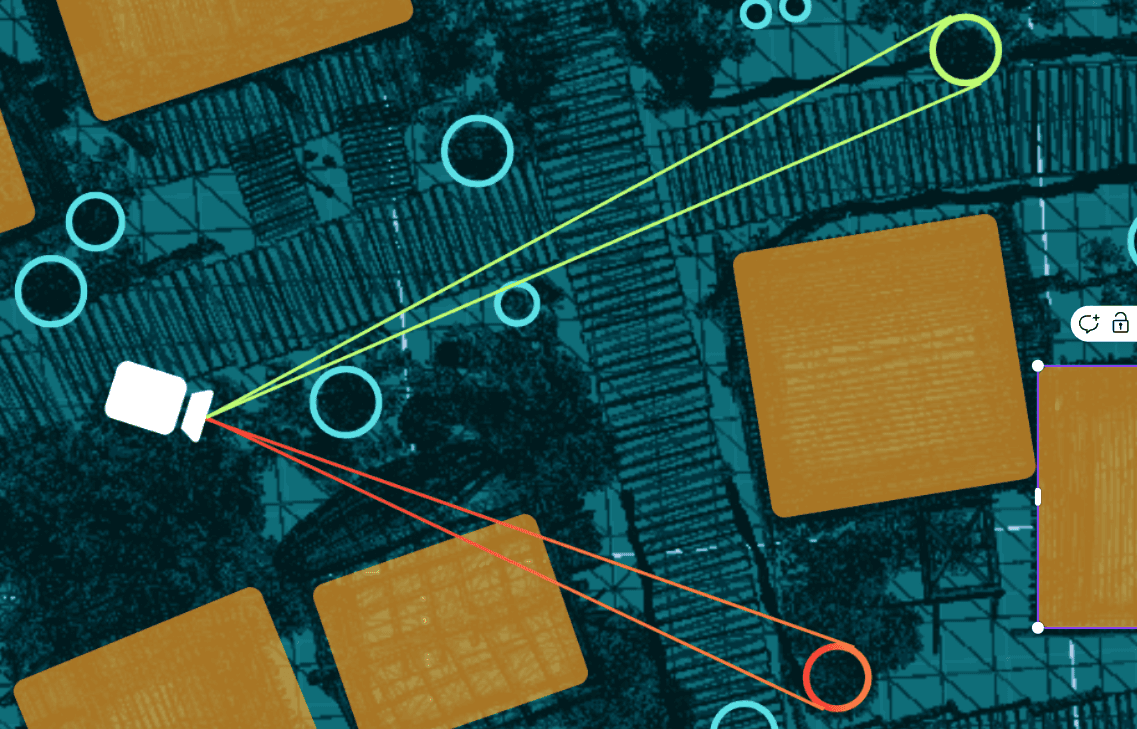
I create a ray towards the occludee center:

I calculate the line distance from the camera to the occluder's furthest point.
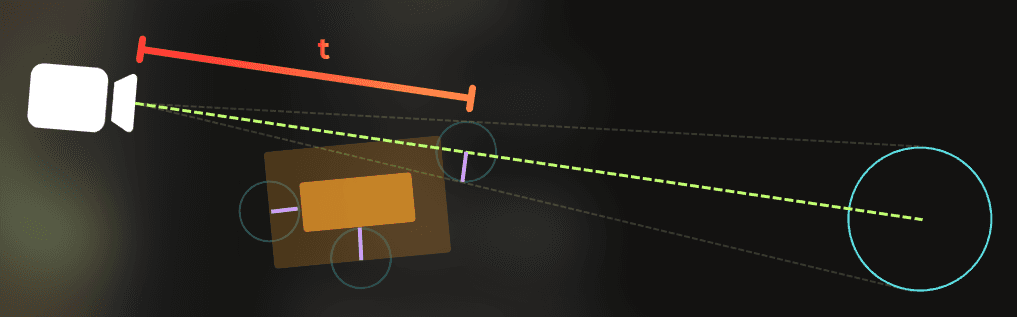
I shrink the occluder by the radius of an occludee, scaled proportionally with the distance.
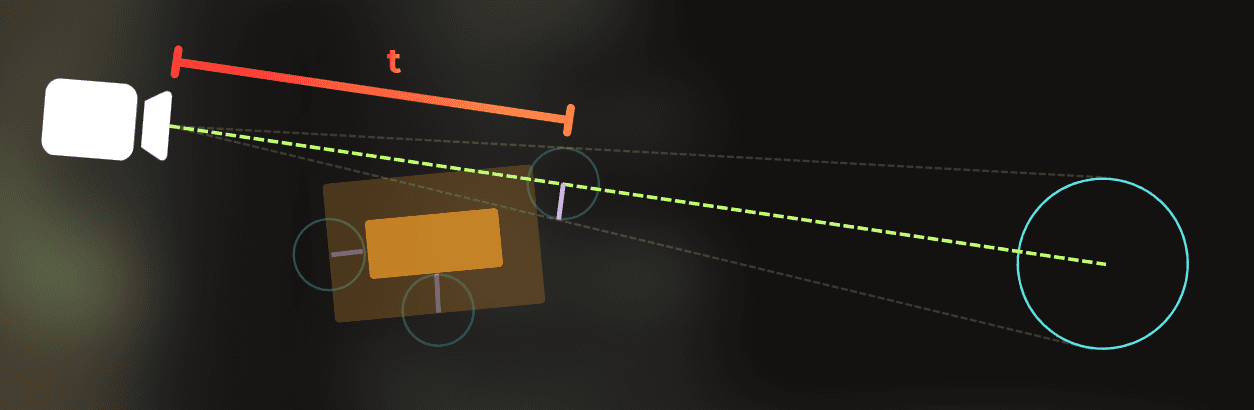
Now, if the ray from the camera to the occludee doesn’t collide with the shrunk occluder, the occludee is visible:
If the ray collides with the shrunk occluder, the occludee is fully covered:
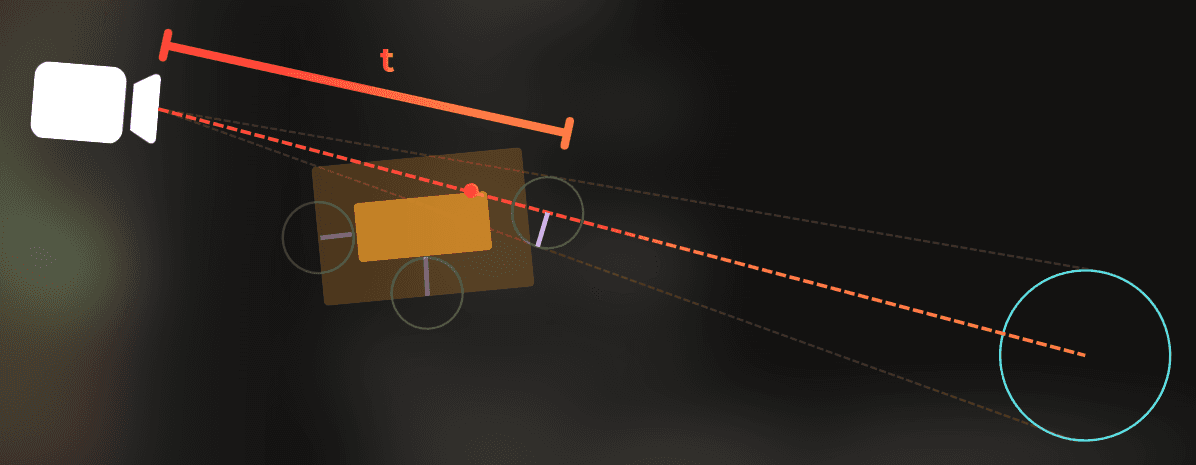
This simple algorithm only manipulates the occluder's size and uses basic raycasting. It can create false-positive visibility, but never false-positive occlusion, which is what I wanted.
This is the source code of the cone-test:
If this algorithm wasn’t known before, I’m happy to name it after me, because it is pretty fast 😆
I also created a debug tool that let me verify that my cone-tracing algorithm was correct. Here you can see how I browse through the small renderers and check if they are correctly detected as fully occluded.
Now, this part is completed:
___
4. Occlusion tests
Now, I need to compute occlusion for each small renderer in the scene, on each frame, and ensure that only visible renderers are rendered by the camera.
I used this function. It is the slowest possible solution that tests each occludee against every other occluder. The goal is to get a set of visible renderers - to be more precise, their IDs.
Now, this is implemented:
___
5. Enabling/disabling renderers
Now I have the function that does the occlusion tests. Once I know which renderers are visible, I need to disable and enable them accordingly.
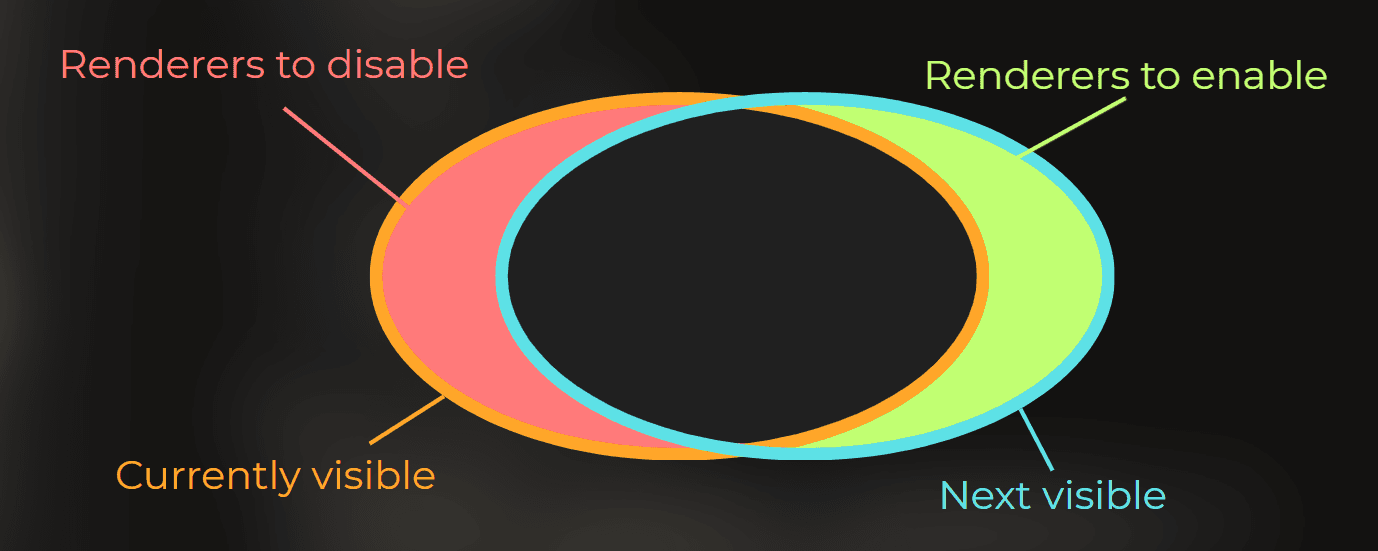
I added this hashset, which will store the IDs of currently visible renderers:
Then, based on currentlyVisibleRenderers and computed nextVisibleRenderers, I can determine which renderers to enable and which to disable. At this point, it is a simple set operation.
So I did that. I run occlusion tests, then compute which renderers to enable and which to disable. This is unsafe code so I can use it with the burst compiler.
I ran the code above as a Burst-compiled job. Then I implemented the code to disable and enable the renderers by setting their forceRenderingOff field.
___
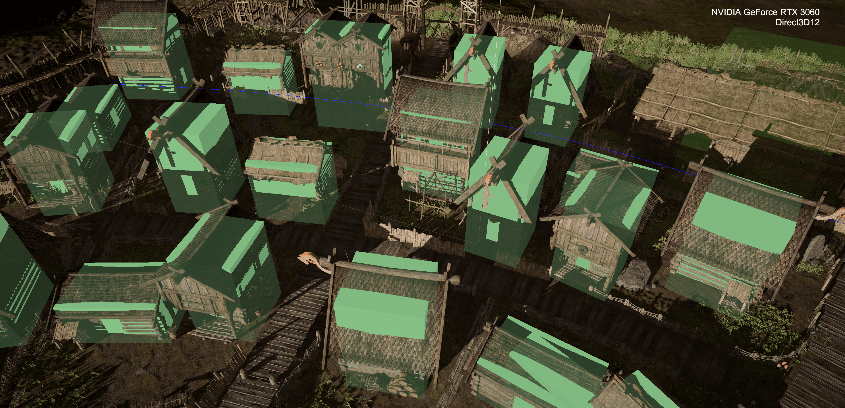
6. Testing my solution
Now it is time to test whether it works properly.
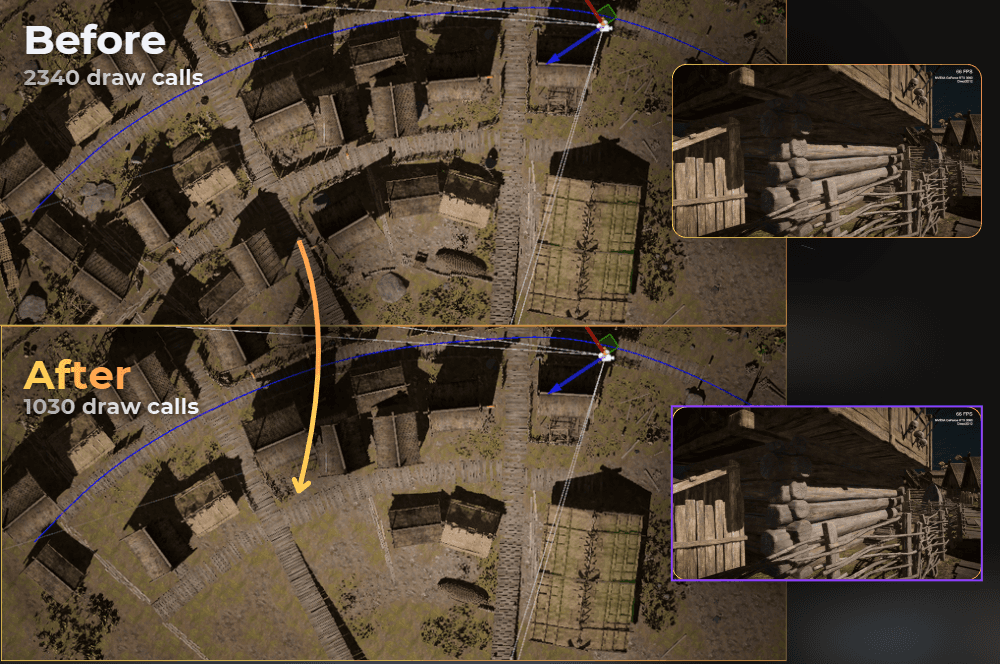
Bwoah! Looks good. But is it faster?
From the first sneak peek into a random frame, it looks fine, as it saved about 25% batches. But we are here to look at frame time, not batch count.
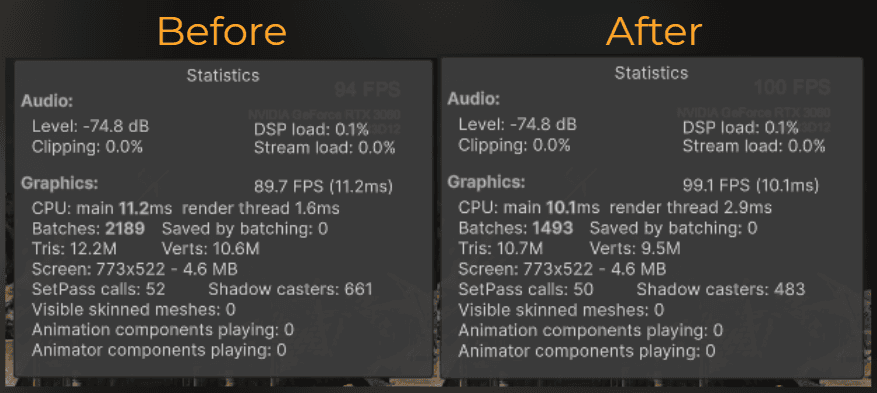
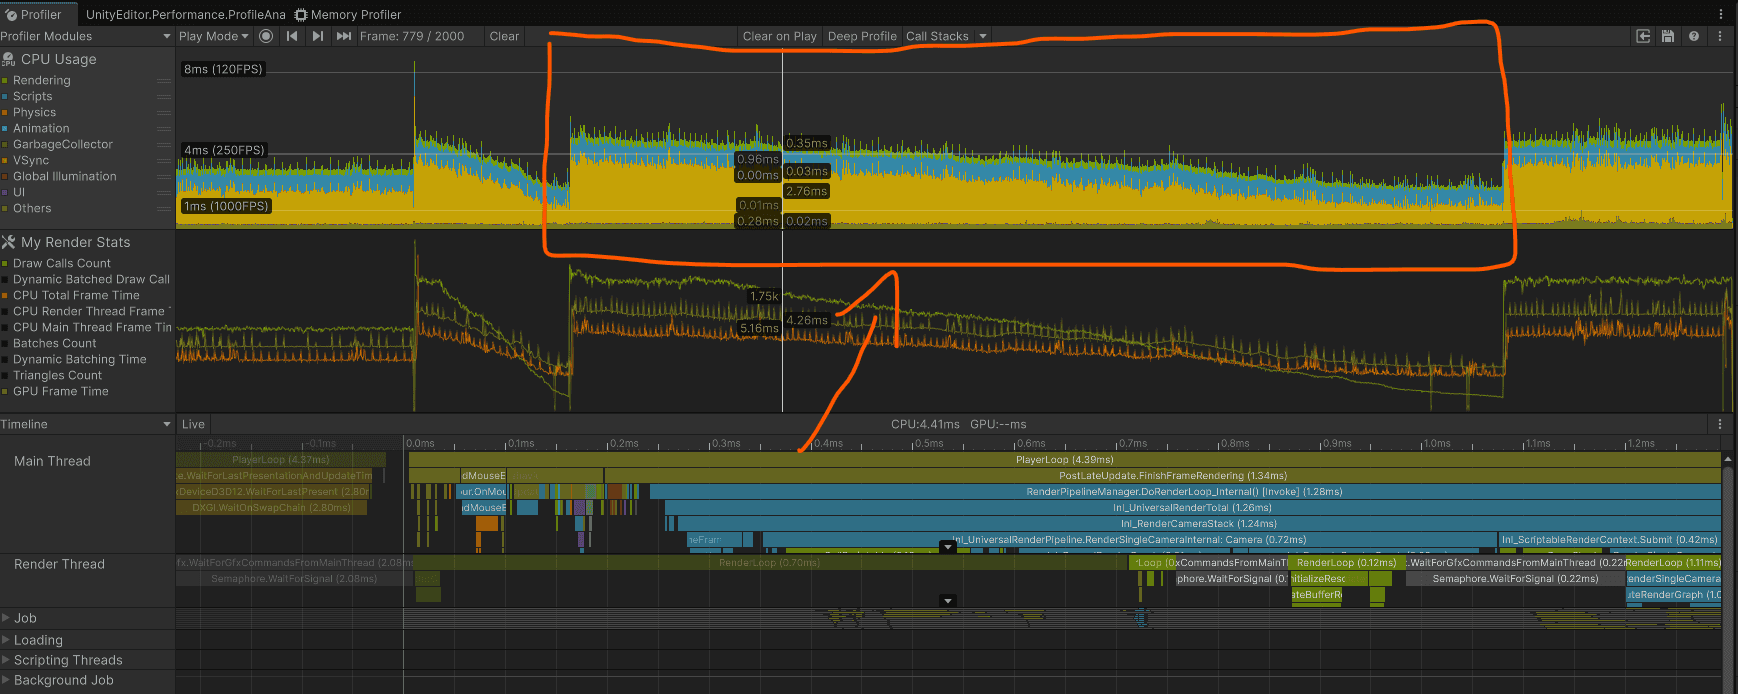
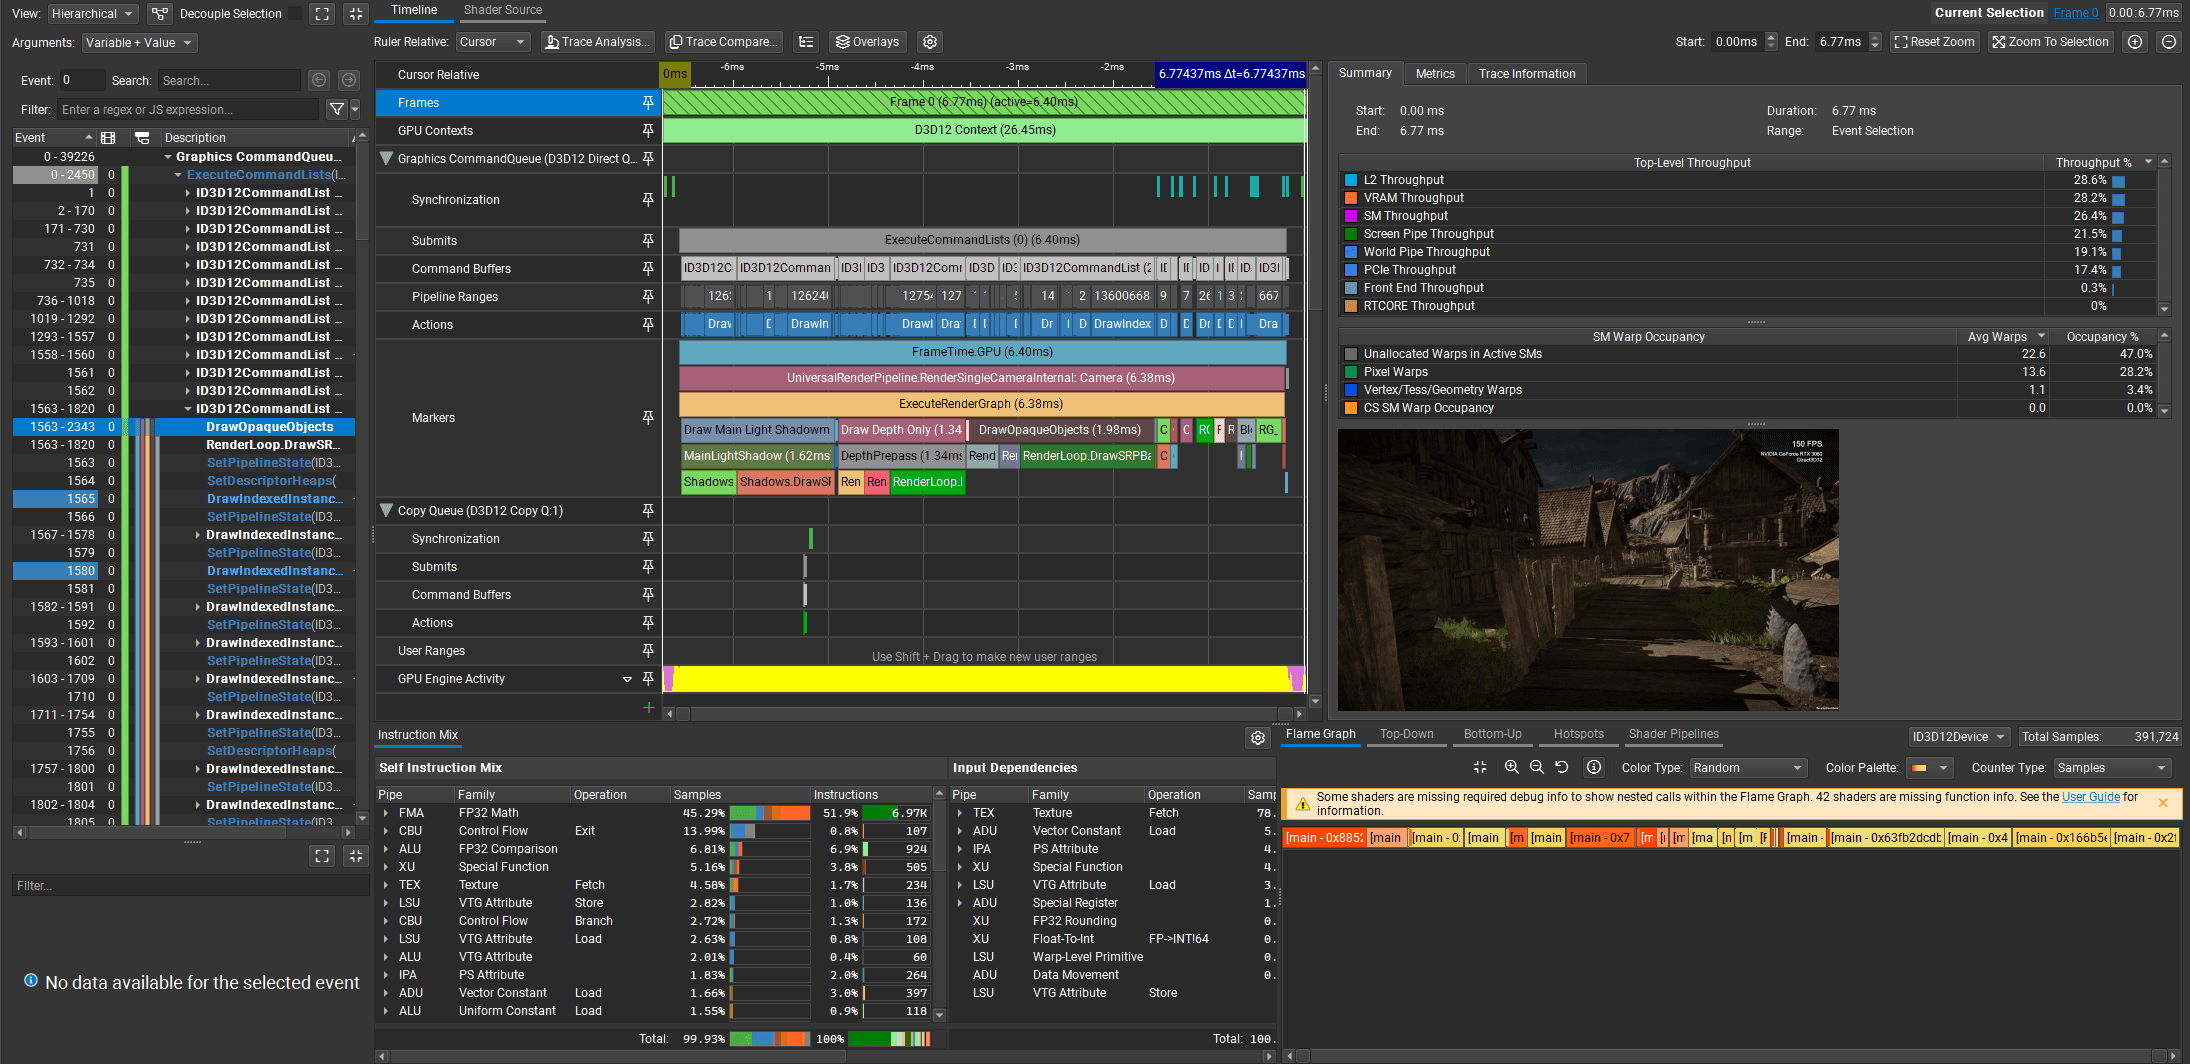
I opened the profiler to see what was happening in the editor, and it didn’t look so bad. 0.27ms to test 35100 different occluder-occludee combinations. From a randomly picked frame:
And those are the benchmark results. My occlusion took 0.32ms more per frame (average):
:center-px:
Not a bad result for the naive approach.
But how can I optimize it so it makes the CPU run faster? Let’s see!
___
Optimization iterations
Parallel computing
I purposefully used unmanaged, low-level code for the occlusion. Occlusion tests don’t use any Unity types, so I can safely run them on a separate thread.
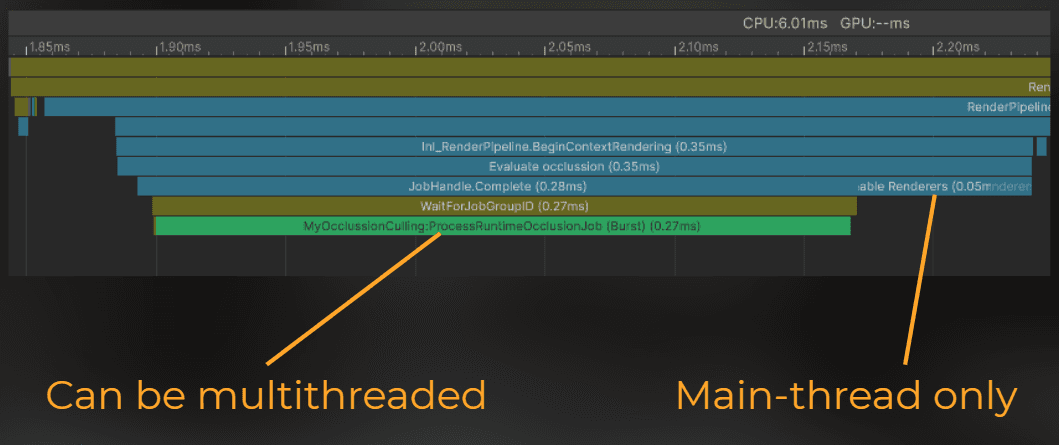
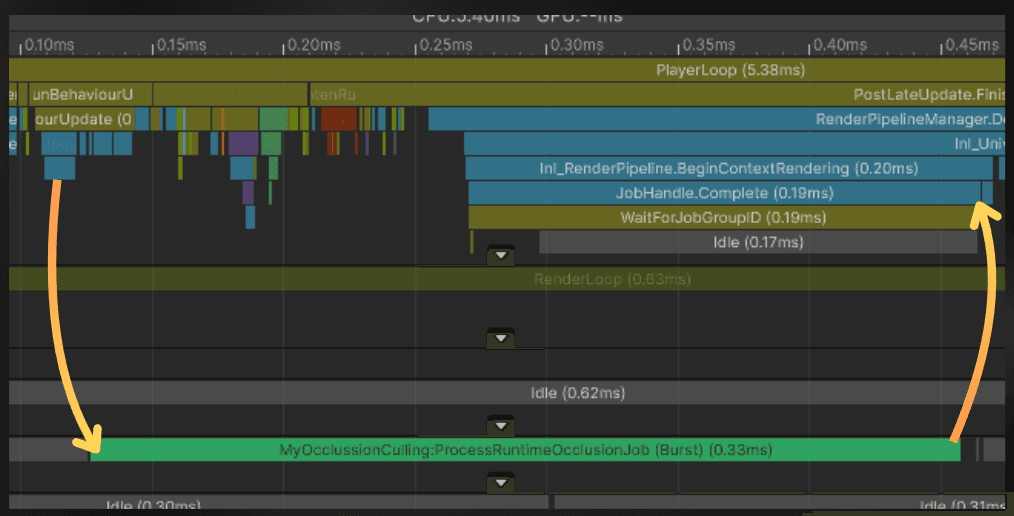
Let’s kick off occlusion culling in Update. It will run the occlusion tests on a separate thread while the engine does its own work.
Then, before the frame is rendered, I will switch the renderers on the main thread.
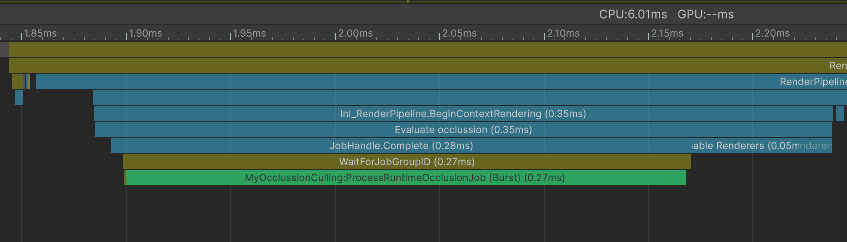
So I moved the ProcessRuntimeOcclusionJob to start during the Update:
And before the frame is rendered, I ensure that this job is completed and I switch the renderers state.
Profiling time! It is still slowing down the main thread, but only when Update, LateUpdate, and building the UI take less time than computing occlusion.
Let’s push it even further.
I have two ideas:
multithreading - utilize all available CPU threads for occlusion
offline baking - bake results into data structure and while in runtime, just fetch the precomputed occludees from the area.
I decided to go for multithreading.
___
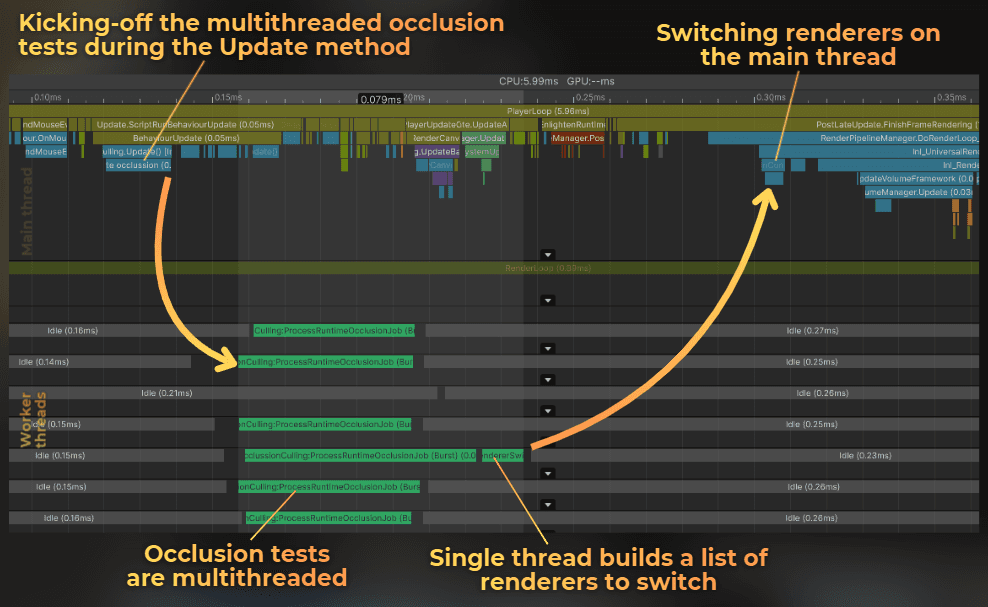
Multithreading
Now let’s use the full CPU power. I modified the code to store each renderer's visibility as a list of booleans instead of an ID hash set. So currently to check if the renderer is visible I could only peek the bool value at renderer's ID.
I did that so I can process each renderer independently on each thread. Now, to override a renderer's visibility, I just set the bool value for its ID.
So I split the occlusion computation into two Jobs. First one computes the visibility for each renderer:
The second job computes which renderers need to be switched on or off. The code below will run on a single thread because it needs to append the IDs of renderers to a list, and adding new elements to a single list is a thread-unsafe operation.
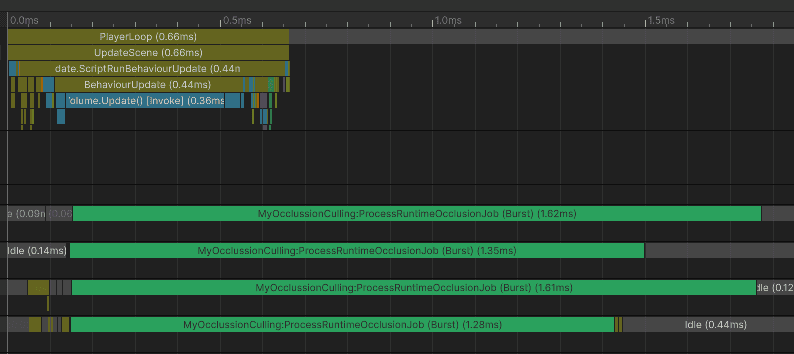
I ran the benchmark - look at this beautiful profiler window.
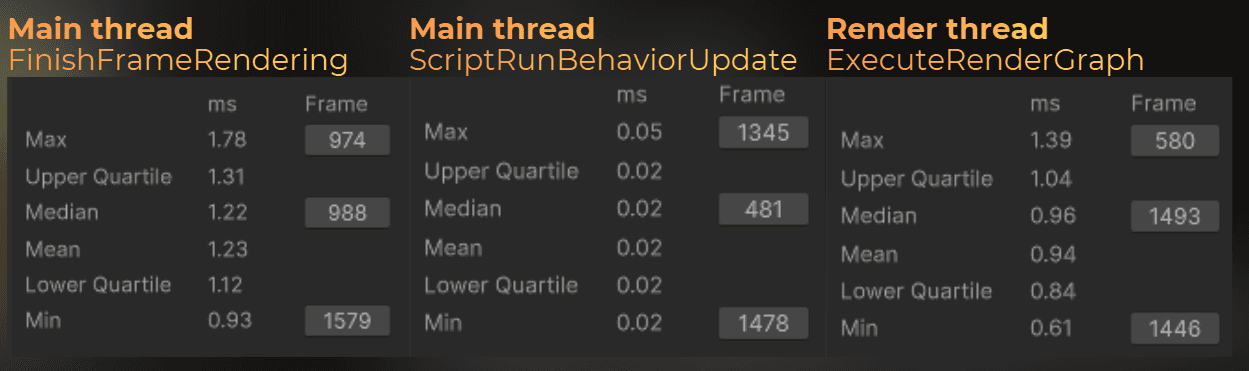
0.019ms to start the occlusion tasks from the main thread
0.079ms to compute the occlusion on another thread.
0.007ms for renderer switching.
Let’s run the proper benchmark and see what exactly happens on the main thread and render thread.
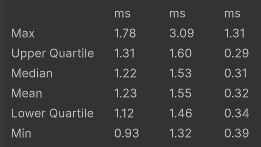
Main-thread difference:
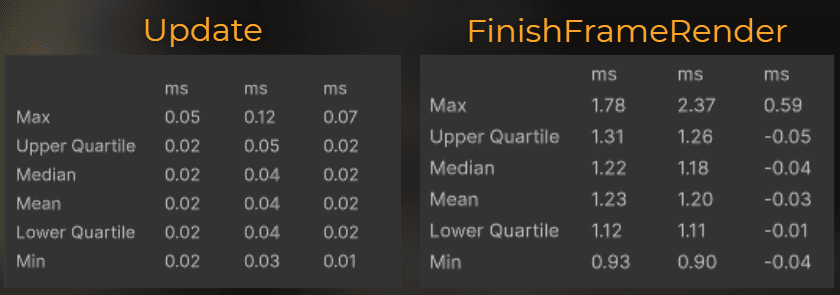
I added about 0.02ms to the Update events in the engine, but saved 0.03ms on average in FinishFrameRender.
Enabling this occlusion slightly improves main-thread performance, because it saves more time processing renderers than it costs to compute the occlusion.
Now let’s look at the render-thread data. This is the only difference I’ve found.
:center-px:
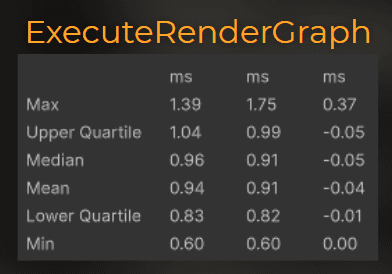
The average frame time on the render thread is 0.04ms shorter.
And GPU?
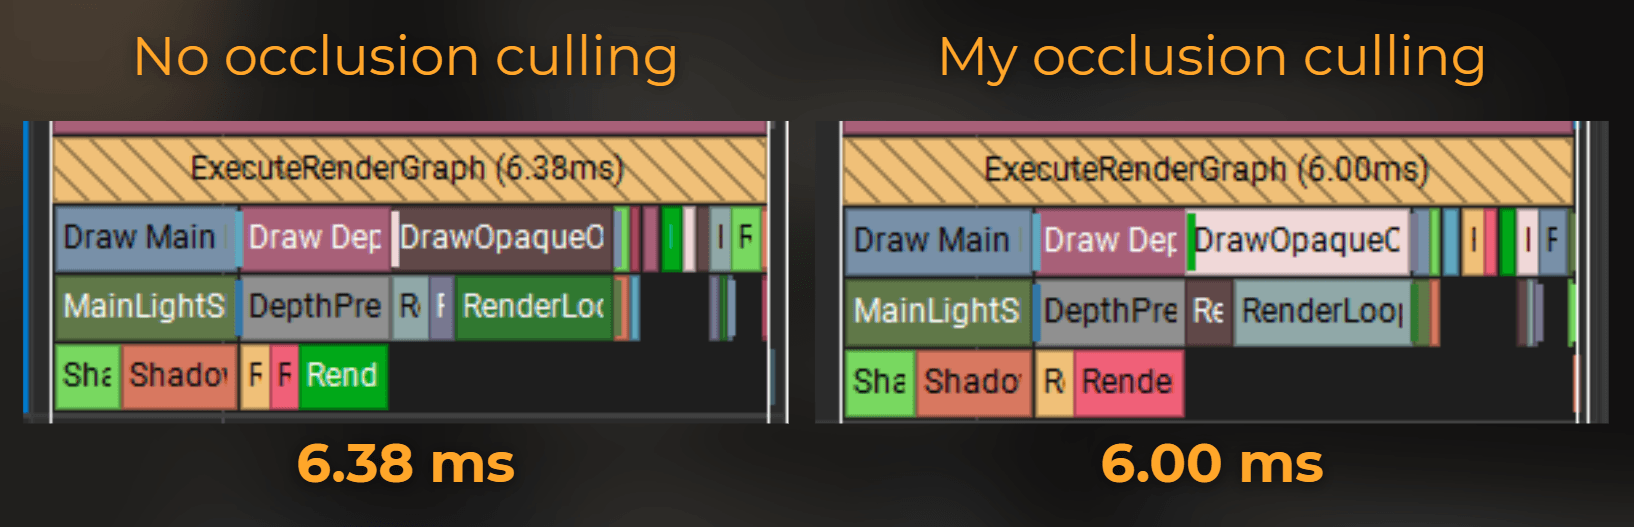
GPU frame time: 6.38ms -> 6.00ms (-0.38ms)
MainLightShadow: 1.62ms -> 1.53ms (-0.09ms)
DepthPrepass: 1.34ms -> 1.23ms (-0.11ms)
DrawOpaqueObjects: 1.98ms -> 1.84ms (-0.14ms)
Bwoah! This simple naive implementation turned out to make the CPU and the GPU run faster!
Pros & Cons
Now you can see that the naive implementation of testing each occludee against each occluder each frame can be faster than any solution provided by Unity. So, where is the catch? Why don’t we see such solutions in the engine?
Well… I haven’t designed my implementation to work perfectly in every scenario. What do I mean? Let’s look at the pros & cons.
Cons

❌ It doesn’t scale well
Adding 2000 occluders brings occlusion computation to 2ms per frame (2 700 000 unique occluder-ocludee combinations), which is a significant amount of time for all parallel threads. So it is not suitable for large games. However, with acceleration data structures for occluders or occludees, it could scale well.
❌ Artifacts
It doesn’t account for shadows. It only considers the object's size and position. In some scenarios, it can turn off objects with visible shadows. To be honest, I needed more than 5 minutes to find the first case (including lighting adjustments), even knowing how it works. In many games, this could be fine. When the gameplay is good, players usually don’t notice such things.
❌ The data used by the occlusion is not up to date
You might noticed that I start the occlusion computation in the Update function, but the camera position can change before the frame is rendered. It means that occlusion results have one frame of delay. I wasn't able to notice any artifacts when the camera was moving smoothly.
❌ Requires manual occluder setup
You can’t just enable it and get better performance. You need to place some blocks.
❌ It makes renderers disappear in scene-view and works only for a single camera.
It is hard to use the scene-view when the game is in the playmode. Also current implementation wouldn't work for more than one camera, because it disables the renderers globally.
___
Pros

Now, let’s focus on positive aspects:
✔️ Custom implementation
I could easily adjust it to cull gameplay logic, animations, particle systems, and more, making the whole game faster, not just the rendering. I have complete control over this tech without relying on a closed-source solution, so I don't need to trust that it works in every scenario in my project.
✔️ Performance
It is very fast. In my scenario, it outperforms any other solution available in Unity Engine.
The performance of your game matters most, not the universality of the tech you use.
✔️ No baking time
Compared to Unity’s built-in baked occlusion, you don’t need to wait, because this occlusion works entirely on runtime data. Nothing prevents you from using this occlusion on runtime-generated content.
___
Summary
In this article, I built a deterministic benchmark and compared three options in my project: no occlusion, Unity baked Umbra occlusion, and GPU Resident Drawer. Then I implemented a custom runtime occlusion culling that’s designed for my game and measured it again.
What happened
I benchmarked the scene the same way every time (same camera path, same frames).
Unity's baked occlusion helped the GPU a bit, but didn’t help overall CPU time in my case.
GPU Resident Drawer reduced draw calls a lot, but increased CPU and GPU frame time overall in my case.
My custom occlusion culling ended up improving main thread, render thread, and GPU time, but only after I moved the work off the main thread and parallelized it.
Core insights
Frame time matters most: I focused on CPU and GPU timings, as lowering the draw call count doesn't always improve the performance.
Simple and stupid can be fast: I used very simple shapes (boxes as occluders, spheres as occludees) and a lightweight cone-tracing test. Then I tested each occludee with each occluder and it was fast enough.
Game-specific solution is better than universal: I didn’t try to solve occlusion for every possible game, only for the constraints that are in my projects. It may not work so well with your project and hardware.
Tradeoffs to keep in mind
It doesn’t scale well if I throw thousands of occluders at it without better acceleration structures.
It can have artifacts (for example, it doesn’t consider shadows).
It needs straightforward manual setup (placing occluder blocks).
You can download the source code here:
ZIP: https://drive.google.com/file/d/1JmU1UQrDAQvC-FpqVFdP0H6Mx4n9oOg5/view?usp=drive_link
UnityPackage: https://drive.google.com/file/d/1fSjG6zQWkFtMQZMJCx7LTv8uu2juUlGG/view?usp=drive_link