Optimizing GPU-driven particle system to run 4x faster
10 min

In the previous article, I built a GPU-driven particle system for a burning object effect:
033 - Spawning GPU-driven particles on a mesh
This article continues that work. The system already runs fully on the GPU, using compute shaders, append/consume buffers, indirect dispatch, and indirect instanced rendering. Now I want to profile it properly and make it faster.
I will show how I reduced the frame cost from 3.19 ms to 0.83 ms, making the system about 3.8x faster.
The goal is to inspect each GPU pass, find the bottleneck, and optimize the implementation without changing the look of the effect too much.
In this article:
I set up a deterministic profiling scenario.
I profile particle spawning, indirect argument preparation, simulation, and rendering.
I improve each simulation and rendering step individually.
I compare the timings before and after optimization.
___
Test setup
I forced rendering to run at 60 FPS:
:center-px:
I also looped the particle effect and froze the dissolve animation. The effect now uses the same noise pattern, particle count, and spawn behavior every time. This creates a deterministic profiling scenario.
![[034-01-also-looped-particle.mp4]]
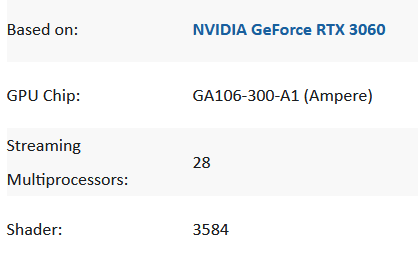
I profiled on:
RTX 3060
Full HD, 60 FPS
___
Performance overview
First, I will walk through the implementation and baseline performance. Then I will optimize each pass.
Let's start with the overall performance.
1. Spawning particles
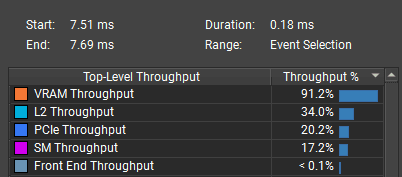
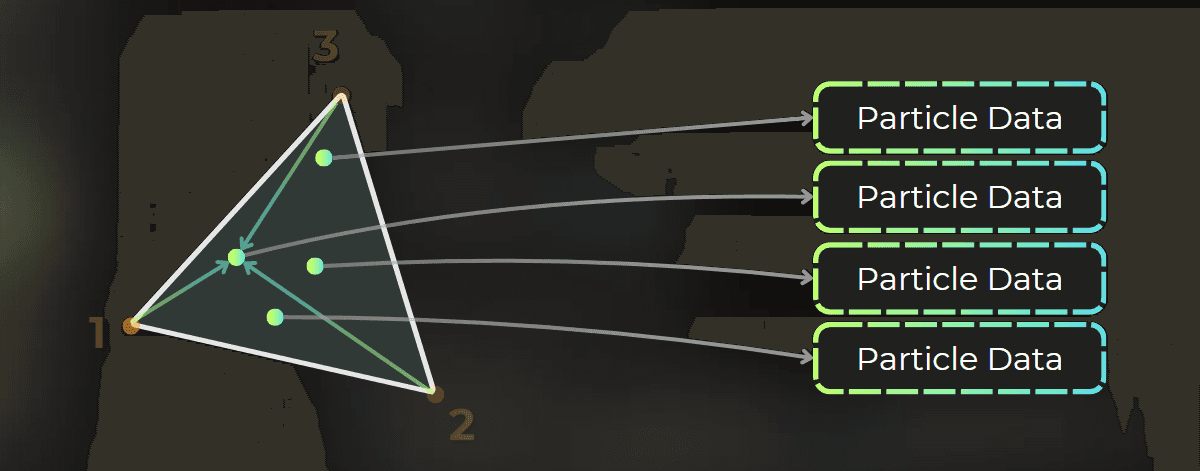
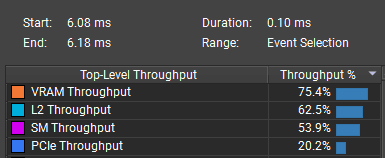
Particle spawning takes 0.20 ms per frame. It launches one thread per triangle and randomly spawns particles inside the triangle based on its area. Particles are added to a buffer with an internal counter using an AppendStructuredBuffer.
Spawning has very low throughput across the GPU, reaching about 3% SM utilization. This points to poor workload distribution, likely because the pass launches too few threads.
:center-px:
:center-px:

Profiling note: this pass launches one thread per source triangle, so the source triangle count is key to understanding spawn performance.
2. Preparing the indirect argument buffer for simulation
The main particle simulation uses indirect dispatch to launch one thread per particle. A compute shader calculates the thread group count for the simulation pass.
:center-px:
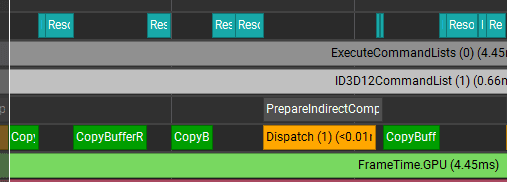
It uses the particle buffer counter and group size to calculate the target group count. It takes 0.013 ms. This is not worth much attention while the other passes are much slower.
3. Particle simulation
Next is particle simulation, which runs one thread per particle. The simulation moves particles from one buffer to another.
A consume buffer fetches each particle. The shader updates the particle and appends it to the output buffer, or skips the append to kill it.
:center-px:
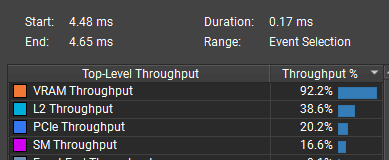
The bottleneck is VRAM, probably from reading and writing particle data. The shader may have a poor data access pattern, or the particle data may simply be too large.
:center-px:
4. Rendering the particles
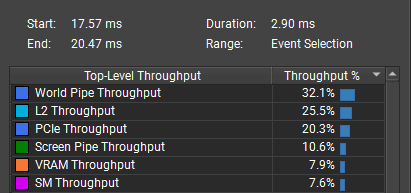
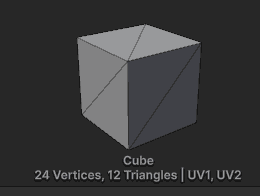
The particles render with additive transparency. They use instanced rendering with a cube mesh: 2 triangles per face, or 12 triangles per particle.
:center-px:
The bottleneck is vertex and triangle processing, shown as world pipe throughput. I need to reduce the triangle count.
:center-px:
___
Optimization iterations
1. Optimizing particle spawning
Particle spawning currently takes about 0.2 ms. It spawns particles per triangle, with one thread running for each triangle:
The performance issue is GPU utilization. Most GPU units do little work, and the pass reaches only about 3% utilization:
:center-px:
The RTX 3060 has 28 SM units and can run 3,584 threads at the same time. GPUs also need extra threads so they can swap work while some threads stall on memory. For this GPU, I probably need to launch 10,000 to 20,000 threads to use it well.
:center-px:
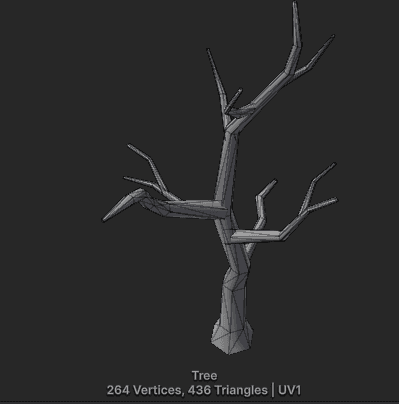
Here, I use a low-poly mesh with only 436 triangles. That is the main performance driver: the pass launches only 436 GPU threads, causing severe underutilization.
:center-px:
Optimization idea:
Launch multiple threads per triangle so the pass starts with at least 10k to 20k threads.
Implementation
I added a constant to the C# code that schedules particle spawning. If the triangle count is lower than the minimum thread count, the system spawns multiple threads per triangle.
Then I adjust the spawn thread count based on the mesh triangle count:
I also send the threads per triangle value to the shader so it can access the correct triangle data:
In the compute shader, I adjust the triangle ID:
I also adjust how many particles each thread can spawn:
Performance improvement
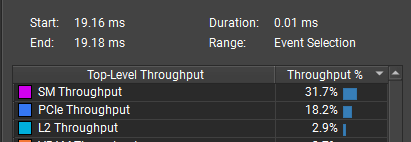
Particle spawning is now about 18x faster. It dropped from 0.20 ms to 0.012 ms.
:center-px:
Workload distribution is much better, with 31.7% average SM throughput and a 68.5% peak.
:center-px:
Here is how I interpret this graph:
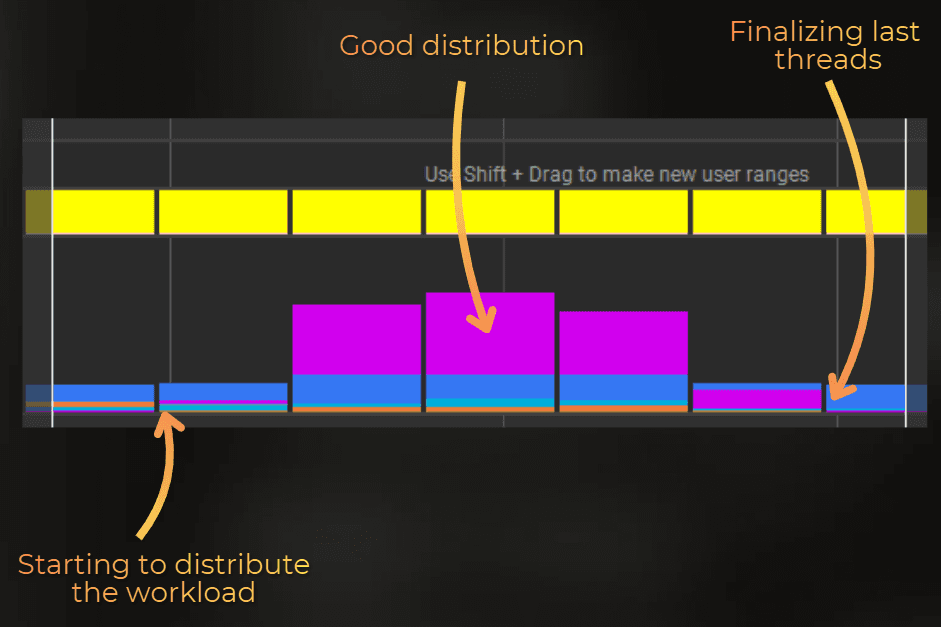
I am satisfied with 0.012 ms for particle spawning, so let's move to the simulation.
___
2. Optimizing indirect draw preparation
Next is indirect argument preparation. This launches the compute shader that prepares the indirect dispatch arguments for particle simulation. Its main role is to calculate the minimum thread group count needed to cover all particles.
This pass takes 0.013 ms, so it does not need much attention. However, I will optimize it as a challenge.
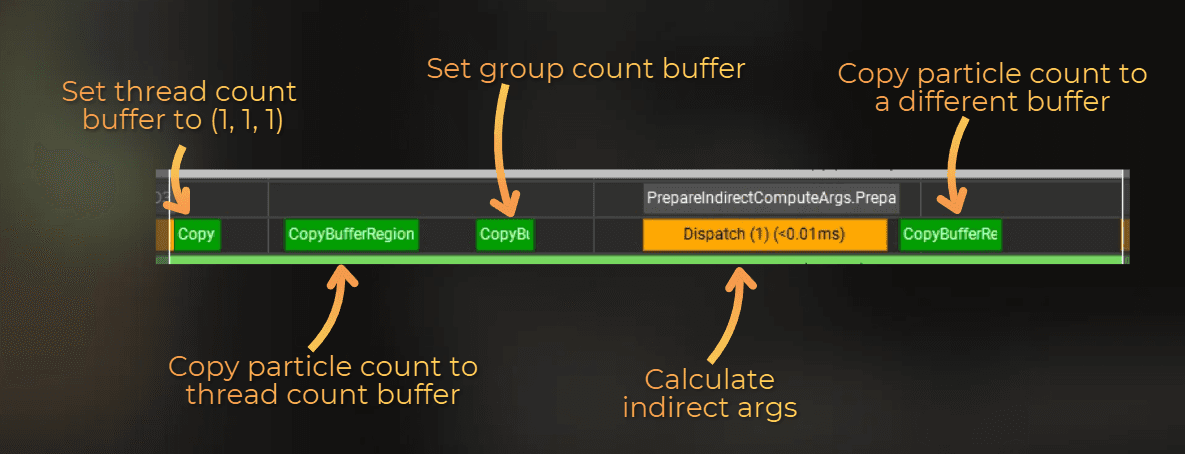
Several things happen here, but some can run once instead of every frame:
Resetting the buffer with target thread counts for particle simulation - does not need to happen every frame
Copying particle counter to the thread count buffer
Setting group sizes in the group count buffer - does not need to happen every frame
Dispatching the compute shader that prepares the indirect argument buffer
Copying the particle counter into a different buffer - I can reuse the thread count buffer instead
Three of these steps are redundant each frame. Let's remove them.
Implementation
In particle simulation, I changed the code to create the thread count buffer and group count buffer with the correct values at startup:
Then, during argument preparation, I only update the particle count buffer and dispatch the shader:
Results
This is how it runs now: one counter copy operation, then a dispatch.
:center-px:
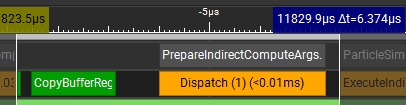
Time dropped from 0.013 ms to 0.0064 ms, making this pass about 2x faster. This optimization would probably matter only when running many smaller particle systems each frame.
3. Optimizing particle simulation
Particle simulation uses a consume buffer to fetch particles: ParticleData particle = _InputParticles.Consume();. It works like a queue on the GPU.
Then the shader updates each particle and appends it to another buffer. Skipping the append kills the particle: _OutputParticles.Append(particle);
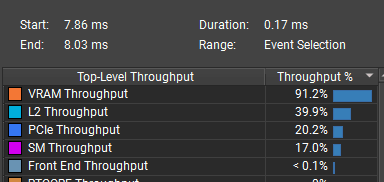
Simulation takes 0.173 ms (measured), and the main bottleneck is VRAM throughput:
:center-px:
The cache hit rate is also very low.
:center-px:
To optimize this pass, I need to focus on the data access pattern and particle data format.
Access pattern
First, I can replace ConsumeBuffer with StructuredBuffer and fetch particles by thread ID. The consume buffer decrements the counter on each fetch, but I do not need that counter here. Replacing it with StructuredBuffer should remove one atomic operation per thread.
So instead of:
I will use:
Result:
Execution time did not change, and the bottlenecks stayed the same.
:center-px:

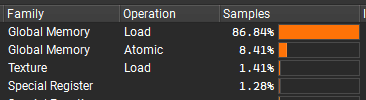
As expected, atomic instructions dropped by about 2x, but execution time did not improve.
Before:
After:
Using groupshared memory
In a compute shader, groupshared memory lets you manually control what is stored in L1 memory. However, when each thread works on one data unit, such as one particle, the data is already cached per thread. Using groupshared memory would probably make this worse.
I tried it anyway:
Load all particles into groupshared memory.
Update the particles in this memory.
Write particles from groupshared memory into the append buffer.
As expected, execution time stayed the same, but the reported shader instruction mix changed slightly. The shader still stalls on VRAM reads:
Before:
:center-px:
After (still stalled on VRAM reads):
:center-px:

Reducing the data size
The current implementation stores all particle data in one buffer. I could split it into "constants per particle" and "simulated data" to reduce how much data each particle reads and writes. However, that would break the append/consume pattern because I would need to keep two buffers in sync.
Instead, I can reduce particle property precision. Rather than storing full-precision velocity, color, size, lifetime, and other data, I will use half precision or byte precision.
This is the original particle format with 64-byte alignment:
This is the optimized format with 32-byte alignment and packed data. It uses half precision for velocity, size, and time, and byte precision for color.
Then I adjusted the C# code and all shaders that use this type. Here is example HLSL code for spawning particles:
To use forced 16-bit types in HLSL, I added these pragmas:
VERY IMPORTANT NOTE:
The minimum shader model that supports native types is 6.2+, and the game must ship on DX12 or Vulkan. This shader will not work on platforms without 16-bit type support.
Supported GPUs start around RTX 2060 (Turing) and RX 6600 for AMD (RDNA 2). We are near the point where PC games can use this in production and still support most players.
To support older hardware, I would need to encode all data with uint values and manually encode/decode them into floats with custom shader logic.
Results:
Simulation time dropped from 0.173 ms to 0.148 ms.

The bottleneck shifted from VRAM to L2 memory, and the cache hit rate improved significantly. Before:
:center-px:
:center-px:
After:
:center-px:
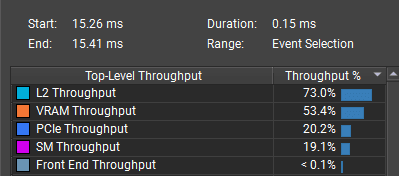
:center-px:
The main benefit is lower GPU resource usage. This pass should run better asynchronously because it blocks main pipe VRAM access less.
Playing with thread group size
Now it is time to test the thread group size. GPU workload distribution can change a lot when the kernel group size changes.
Original group size: 32
Time: 0.148 ms
Main bottleneck: L2
:center-px:
Group size 16:
Time: 0.105 ms
Main bottleneck: VRAM
:center-px:
Group size 8:
Time: 0.161 ms
Main bottleneck: SM
:center-px:
The 16-thread group size was much faster than 8 or 32 threads. With the bottleneck on memory reads, I do not think I can push it much further.
It appears that 16-thread groups reduce per-warp memory sector fan-out and append-buffer pressure, which fits the RTX 3060 well.
Simulation optimization summary:
I reduced particle simulation time from 0.173 ms to 0.105 ms (~40% faster) by:
Using lower precision for particle data, reducing the stride from 64 bytes to 32 bytes.
Using 16-thread groups instead of 32-thread groups for simulation, which improved memory access on the RTX 3060.
Before:
:center-px:
After:
:center-px:
The bottleneck stayed on VRAM, so further optimization would require reducing the data read and written per particle even more. I do not know how to push it further with this design.
___
4. Optimizing particle rendering
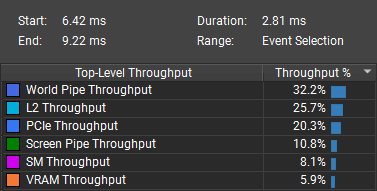
The particles use instanced rendering with additive transparency. Rendering about 500,000 particles takes 2.81 ms.
:center-px:
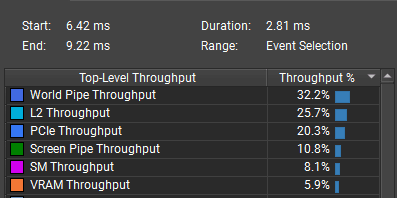
The bottleneck is world pipe throughput. This means the GPU processes too many vertices and triangles compared to the number of pixels. The renderer draws 3x to 4x more triangles than pixels:
:center-px:
To optimize this pass, I need to reduce the number of triangles per particle.
Currently, each particle renders as a cube with 12 triangles: 2 triangles per face.
:center-px:
But each cube covers only about 2 to 4 pixels on the screen at Full HD.
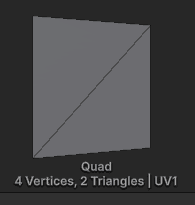
Replacing the cube with billboard quads
My first optimization is to replace the cube with a quad. When each particle covers only 3 to 4 pixels, the difference is not visible. This should reduce the triangle count by 6x.
:center-px:
However, simply replacing the cube with a quad creates a camera-alignment problem. Some quads disappear from certain camera angles.
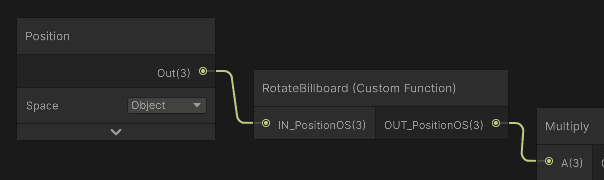
The solution is to rotate each instance toward the camera. Quads that always face the camera are called billboards, so I will tweak the shader.
I added custom HLSL code that rotates local-space vertices toward the camera. In instance rendering, object space is the same as world space, which keeps the shader simple.
I added it just after reading the position in the shader:
:center-px:
The rendering now looks correct:
I also adjusted particle size so the effect renders almost the same pixel count:
:center-px:
Performance improvement:
The triangle count is much lower, and each particle now renders about 2 pixels.
:center-px:
Overall render time dropped from 2.81 ms to 0.71 ms while rendering the same number of pixels.
Before: 2.81 ms
:center-px:
After: 0.71 ms
:center-px:

The bottleneck is still small-triangle rendering, but screen pipe efficiency increased by about 4x. To optimize further, I would need to use 1 triangle per particle. The L2 cache is also starting to become a problem, but lowering the triangle count should still help.
One triangle per particle
I created a mesh with the same area as the quad: 1 unit square.
:center-px:

Render time improved by 0.02 ms, dropping from 0.71 ms to 0.69 ms. At this point, it could be measurement error:
:center-px:
Reducing the triangle count further is no longer useful.
To improve it further, I would likely need to abandon the vertex/fragment path and implement direct particle rasterization in a compute shader. That is a topic for another article.
___
Summary
The biggest win came from particle rendering. Replacing cube particles with billboard quads reduced render time from 2.81 ms to 0.71 ms while keeping a similar pixel count. Particle spawning also improved after increasing the number of launched threads, and simulation became faster after reducing particle data size and changing the thread group size.
Step | Previous time | Optimized time | Improvement |
|---|---|---|---|
Particle spawning | 0.20 ms | 0.012 ms | ~18x faster |
Indirect argument preparation | 0.013 ms | 0.0064 ms | ~2x faster |
Particle simulation | 0.173 ms | 0.105 ms | ~40% faster |
Particle rendering | 2.81 ms | 0.71 ms | ~4x faster |
Sum | 3.196 ms | 0.8334 ms | ~3.8x faster |
After all optimizations, the main remaining cost is rendering very small particles. Reducing the mesh to one triangle did not help much, so the next major optimization would probably require a different rendering path, such as direct particle rasterization in a compute shader.
I will leave it here, though. Simulating and rendering half a million particles in 0.833 ms on an RTX 3060 is already a strong result.