Profiling
Intermediate
Optimization
Deep dive
How to properly profile mobile GPU using ARM Streamline
15 min
My experience with mobile profiling is that mobile devices, especially Android, lack proper tools for performance analysis.
In this article I show how I work around this issue and make the ARM Streamline profiler one of the best tools for identifying GPU performance issues on mobile.
You will learn how to profile mobile ARM GPUs:
What ARM Streamline is and what it captures
How to create custom queries for ARM Streamline and calibrate them for a specific device, so the data is actually useful
How to use this data with RenderDoc to guide your optimizations
___
What is ARM Streamline
ARM Streamline is a mobile profiler that can read detailed performance counters from your mobile GPU.
It is a standalone Windows program that is a part of the ARM Performance Studio. You can download it here:
https://developer.arm.com/Tools%20and%20Software/Streamline%20Performance%20Analyzer
After you launch it, you can plug in your phone with a USB cable and launch a mobile application through the UI. This will launch the app and stream the captured performance data to your PC.
Unlike other tools, ARM Streamline captures all counters continuously with some limited precision. You can't capture a single frame and analyze it. But you can inspect a continuous graph of the captured counters.
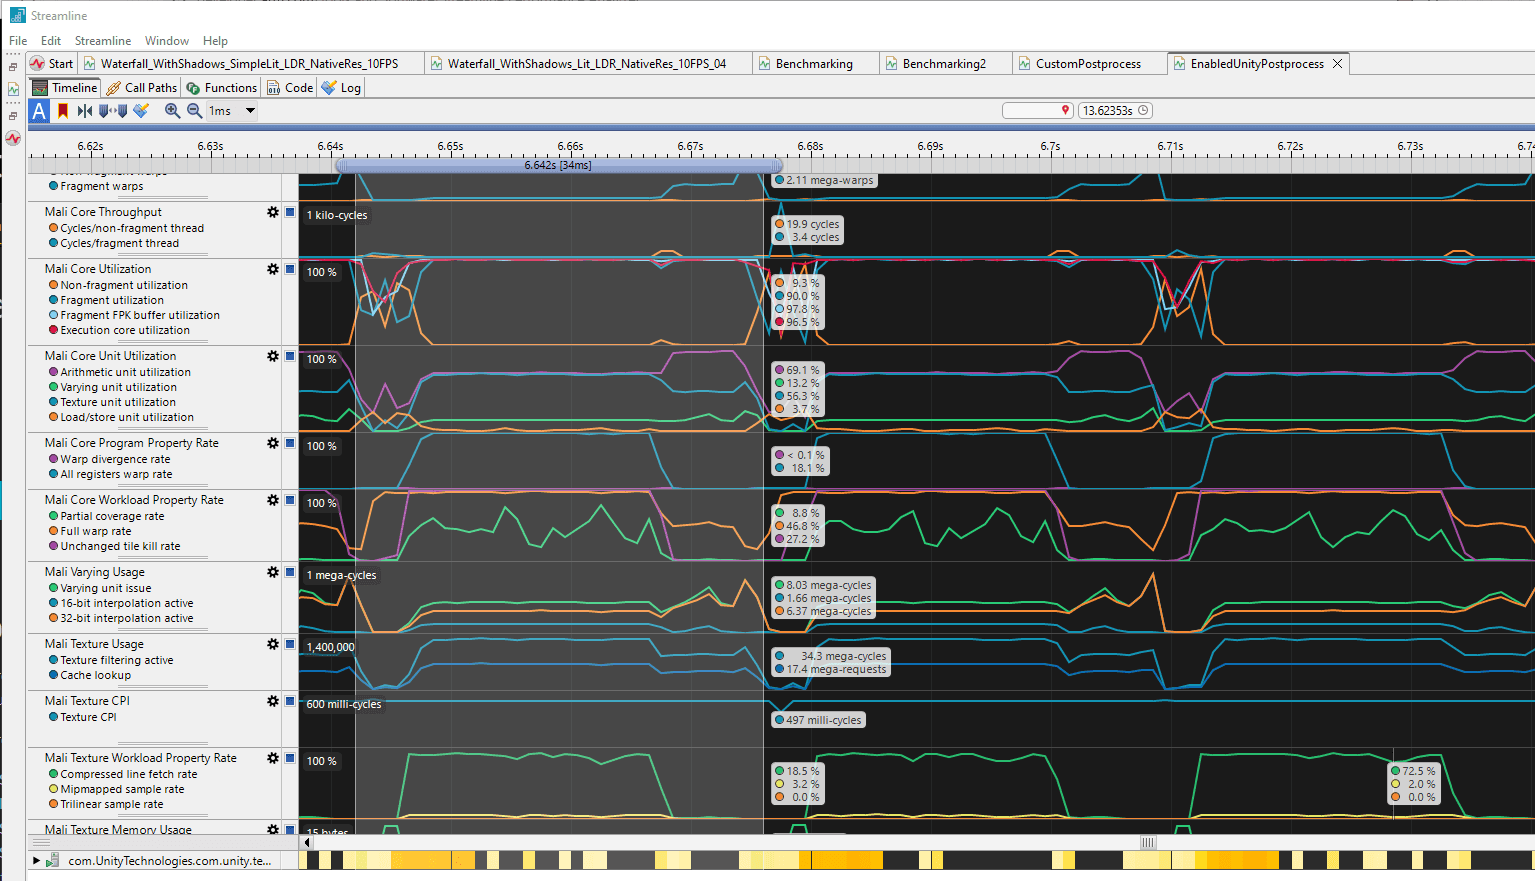
You may notice a few problems with this tool:
First issue: Captured counters are hard to interpret, as they represent raw numbers, like the number of bytes read from L2 or the number of ALU instructions executed. There is no information about how much the GPU is saturated on those units.
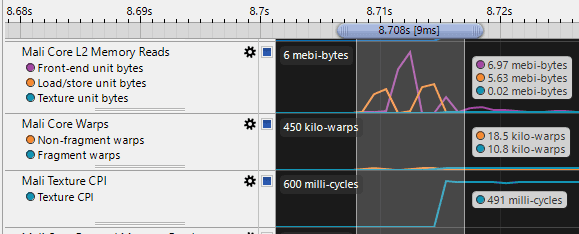
For example: how can I know if 7 mebibytes transferred from L2 cache over 9 milliseconds is close to the maximum capacity of the GPU? This data is very hard to interpret.
Second issue: No profiler labels. No way to clearly see where the frame starts. No way to tell which render passes are executed and when. ARM Streamline can't use Vulkan or OpenGL profiling labels, so you don't know what is rendered or even where the frame starts.
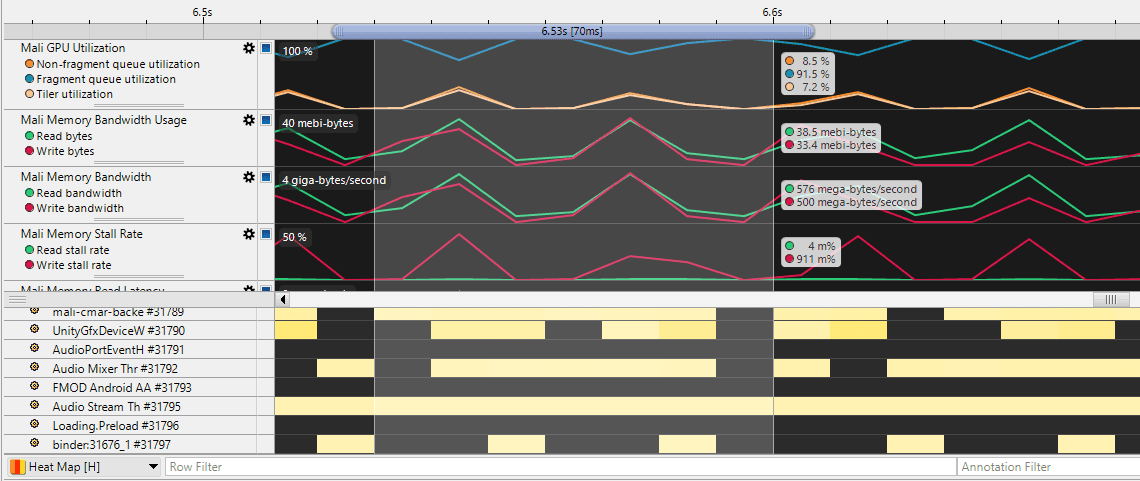
Let me show how I deal with those issues.
___
Improving the performance counters
When I work on optimization, the most important information for me is which GPU hardware units operate close to their maximum capacity. Usually, units with the highest utilization are the ones that create a bottleneck in the pipeline.
For example: if fragment shading is saturated and other units operate with low throughput, it means that fragment shading blocks other units in the pipeline.
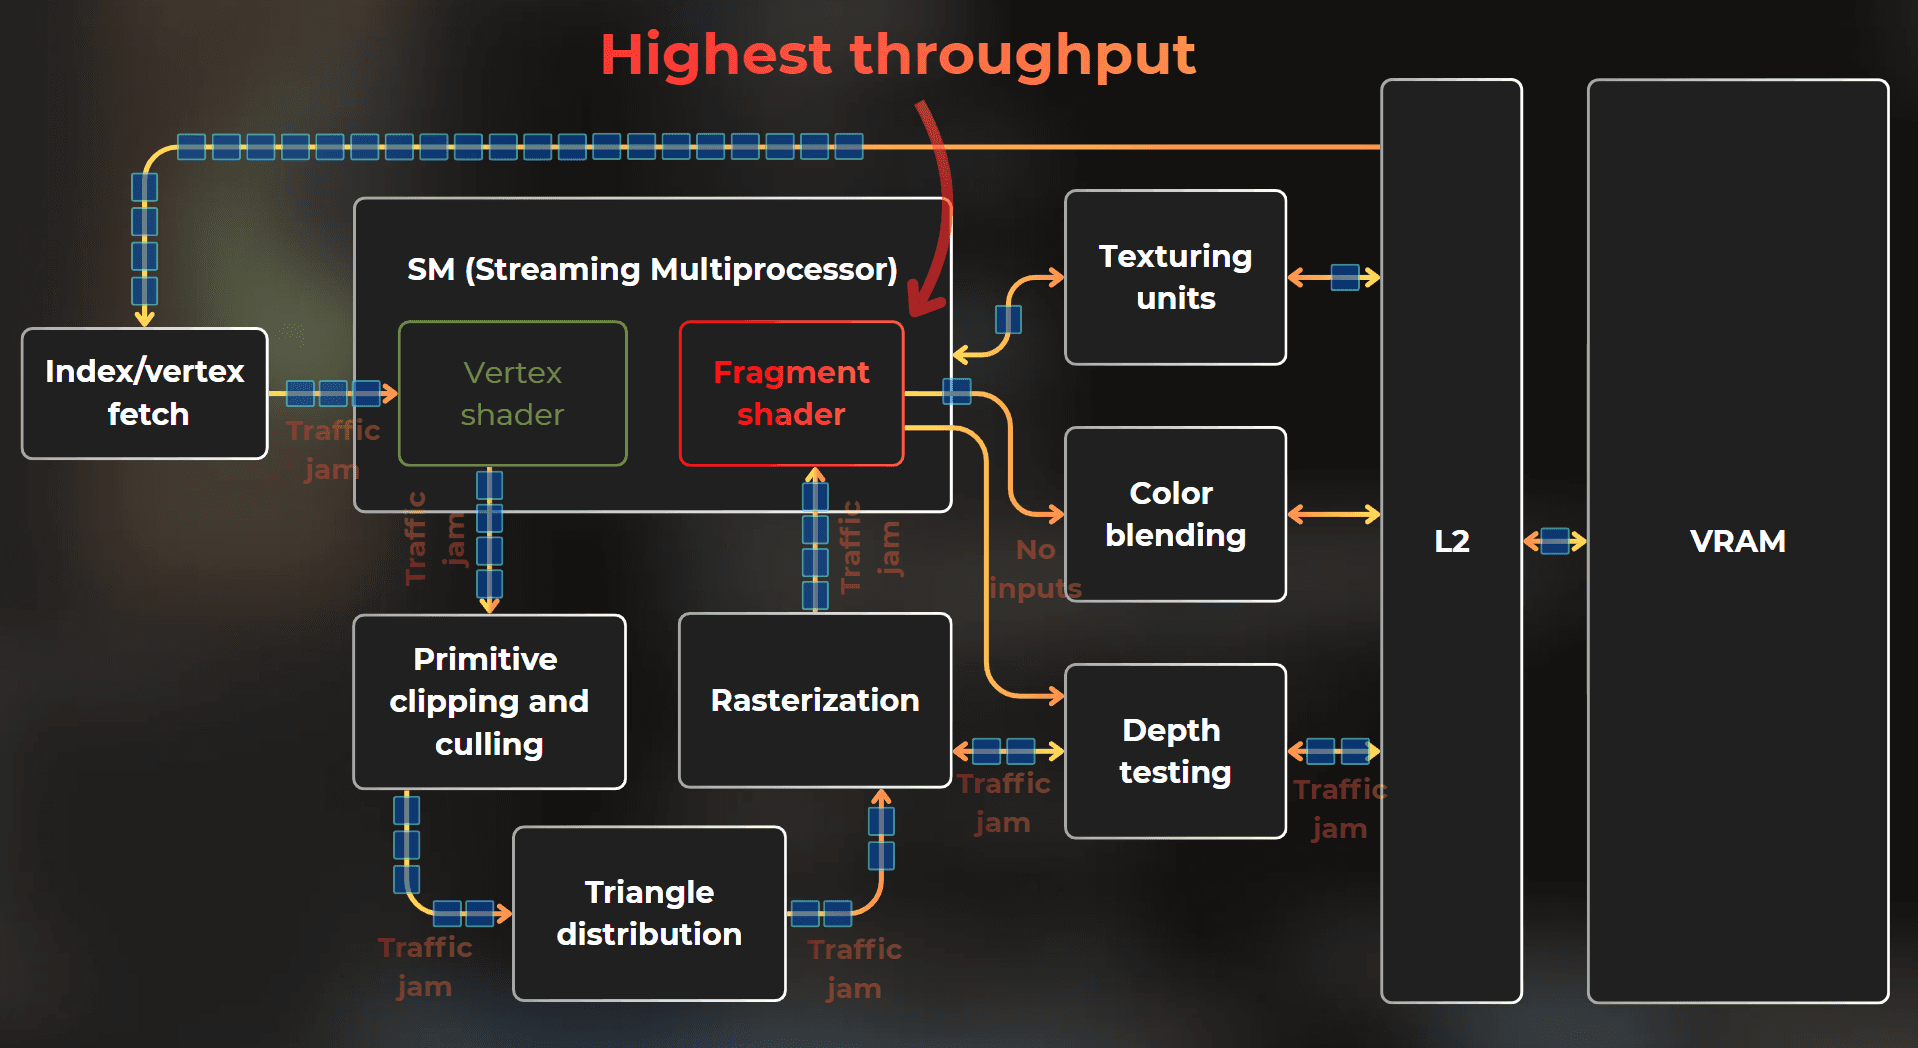
And when all throughputs are low, it means that GPU state switching happens too often or that I render objects that are too small on the screen.
So knowing which GPU units operate close to their max throughput is crucial to identify the bottleneck.
ARM Streamline displays raw counters: how many instructions were executed by the ALU, how many filtering queries were executed by texturing units, how many bytes went through the L2 cache, etc. However, I don't know if reading 1.74 mebibytes from memory is close to the maximum capability of this GPU:
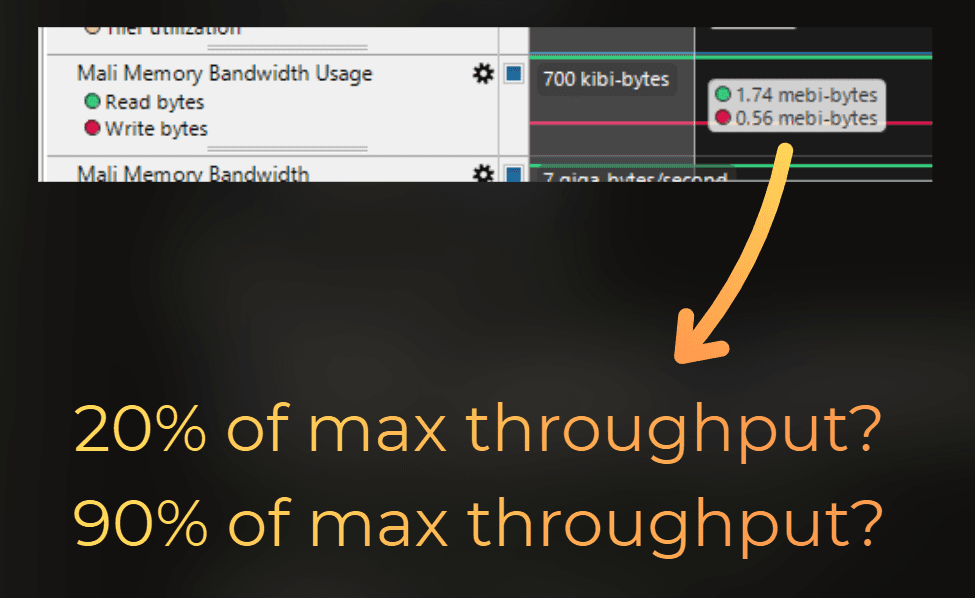
This is why I need to create custom profiler queries that convert raw performance counters to normalized throughputs.
___
Calculating the throughput
To calculate throughput, I need to know the maximum utilization of the unit.
I could create a benchmark that stresses specific part of the GPU as much as possible and then assume that what I've measured is the peak capacity of this specific GPU.
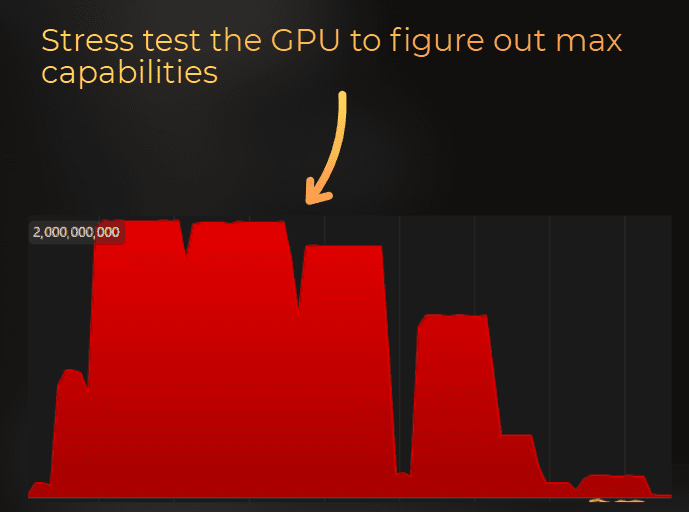
Then, I could compare every other measurement of this raw counter to the maximum capacity to estimate the throughput.
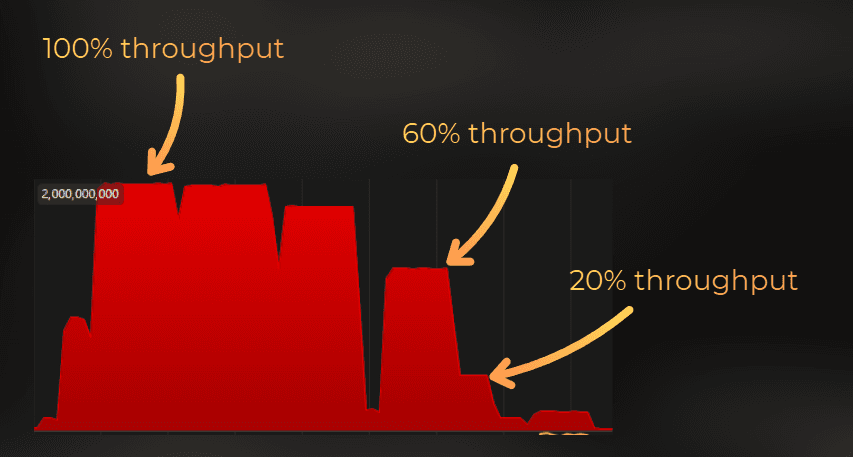
So the workflow is:
Start with a raw hardware counter, like ALU instructions.
Divide it by GPU active cycles, so the value is measured per GPU clock cycle.
Run a benchmark that should saturate this specific GPU unit.
Add a calibration multiplier, so the saturated benchmark lands around 100%.
After that, the number is not a perfect hardware truth. But it becomes a practical percentage that tells me if this part of the GPU is close to saturation.
Figuring out the ALU throughput
ARM Streamline allows me to plot custom queries for performance counters, so let's figure out the throughput query for the ALU.
The ALU is responsible for floating-point calculations in the vertex and fragment shader. To stress test it, I can run a fullscreen shader with a lot of matrix operations.
So I prepared a shader that executes a lot of hash functions based on matrix multiplication. This is the code. I used AI to generate a complex hash function that mostly uses floating-point multiplication and addition:
Then I ran the shader on my mobile and profiled it using ARM Streamline.
I looked at the original queries and found the $MaliALUInstructionsExecutedInstructions marker responsible for tracking ALU instructions.
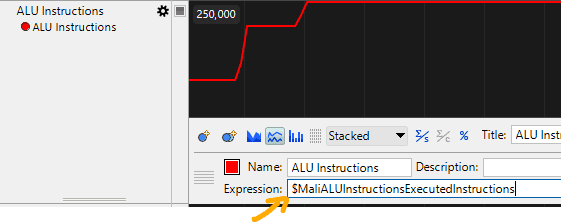
I divided this counter by GPU clock cycles to find the maximum instruction count for a single GPU clock cycle.
For this specific device, the maximum number of instructions per GPU cycle I got was 2.
It doesn't mean that this GPU executes just two floating-point operations per GPU cycle. It just means this counter increases a maximum of 2 times per GPU clock, whatever this counter is representing - it doesn't matter so much as long as it increases when I use more math in the shader.
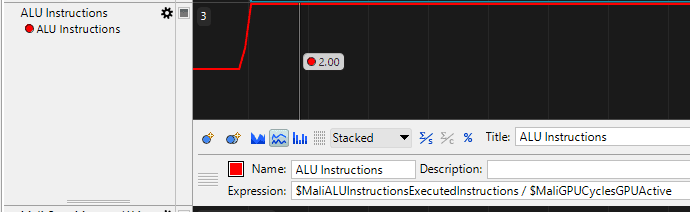
Now I need to add a multiplier and tweak it to make the counter show 100% in the benchmarked scenario. In my case, I divided the result by 0.02 to get the throughput percentage.
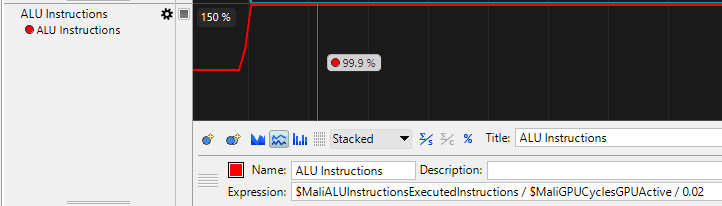
Now I have a query for calculating ALU throughput on this specific device.
Note: this query is accurate only for the specific device I used to run the benchmark. Using this query on any other device will create invalid results.
Now I can run the game with ARM Streamline and track ALU throughput! Isn't it cool?
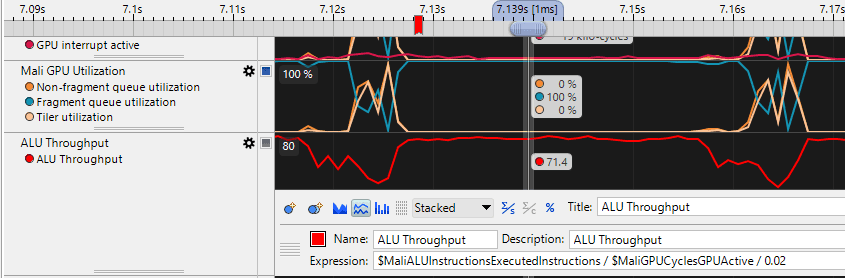
Now, to make the profiler fully usable, I need to create a benchmark targeting each GPU unit separately. This is a time-consuming process. I spent a good few evenings creating benchmarks and compiling different projects.
Example benchmarks:
L2 cache: Bloom postprocess with a pyramid buffer. This creates many texture reads from intermediate render targets and helps stress cache read traffic.
Texture filtering: Sample a very low-resolution texture many times with filtering enabled. The goal is to keep the texture unit busy, not to stress memory bandwidth.
Early Z: Render opaque objects with an unlit shader to low-precision color and depth buffers. Render objects close to the camera first, then a lot of opaque objects behind them. This should stress early depth testing and hidden fragment rejection.
Late Z: Render a lot of objects like above, but randomly discard pixels in each fragment shader. This makes the GPU use late-Z tests.
Input primitive: Render huge meshes with different vertex attribute formats. This stresses vertex input and primitive processing. Render vertices outside of the screen to stop the workload there.
Triangle culling and raster: Render lightweight meshes with triangles of various sizes, in groups: long triangles, small triangles, large triangles, triangles outside of the screen, triangles behind the camera, etc. This helps separate primitive culling and rasterization pressure.
RAM throughput/tile write: Run fullscreen passes into GBuffer, switch render targets between each draw, and reuse the previous GBuffer in texture reads. Or use an 8K uncompressed texture and sample random locations many times in each pixel shader. This pushes external memory traffic and tile write pressure.
I also compiled a few different private projects:
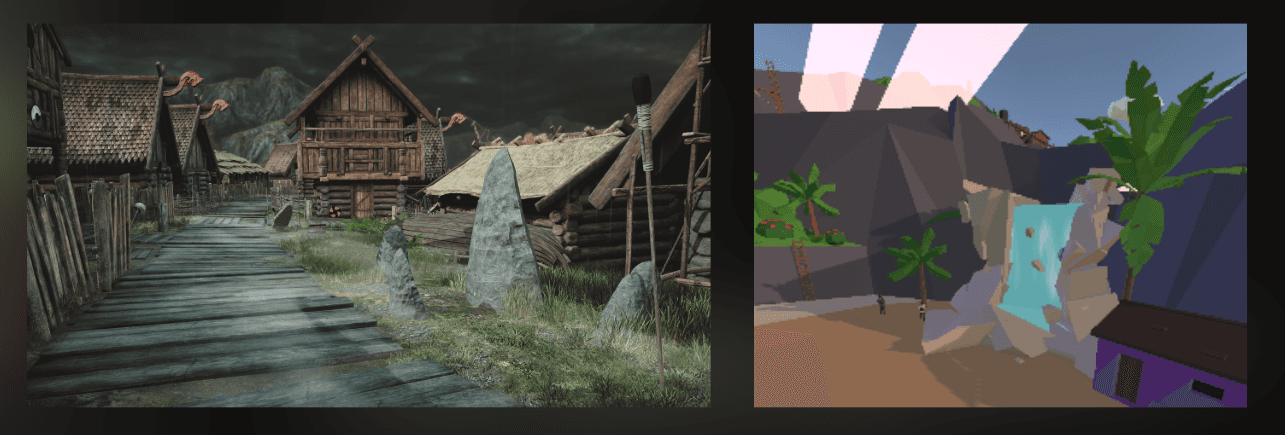
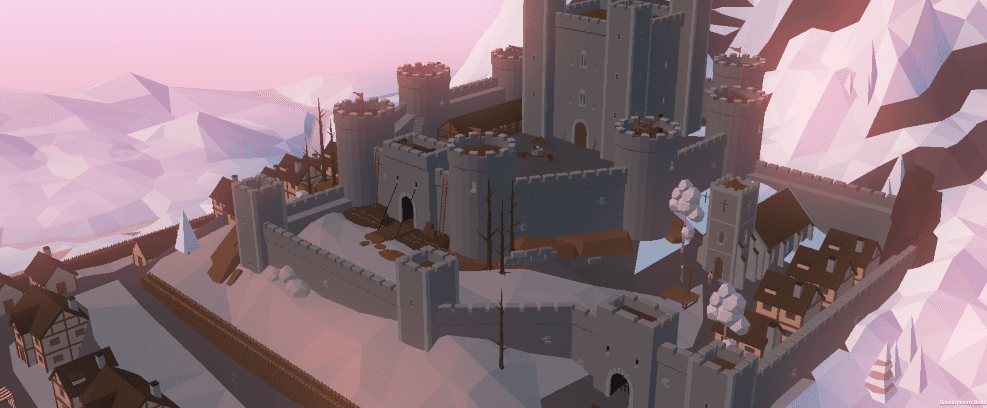
And this is how one of my benchmarking programs looks:
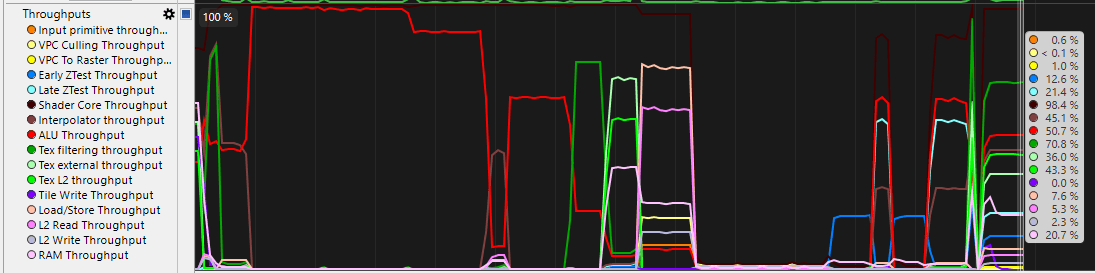
I went through all the spikes there and adjusted the multipliers and queries to make them represent 100% throughput for the respective units. These are all the queries I came up with for my Redmi 12:
Are the above queries correct? Probably not. However, they provide me with throughputs that are good enough to identify the true performance bottlenecks.
Over time, when working on different games, I adjust those throughputs if I notice that some throughput goes above 100%.
I saved the profiler template into a file, so I can load it each time I profile on my Redmi 12.
:center-px:
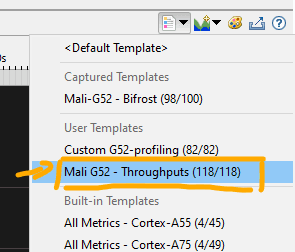
Now, the profiler, instead of this:
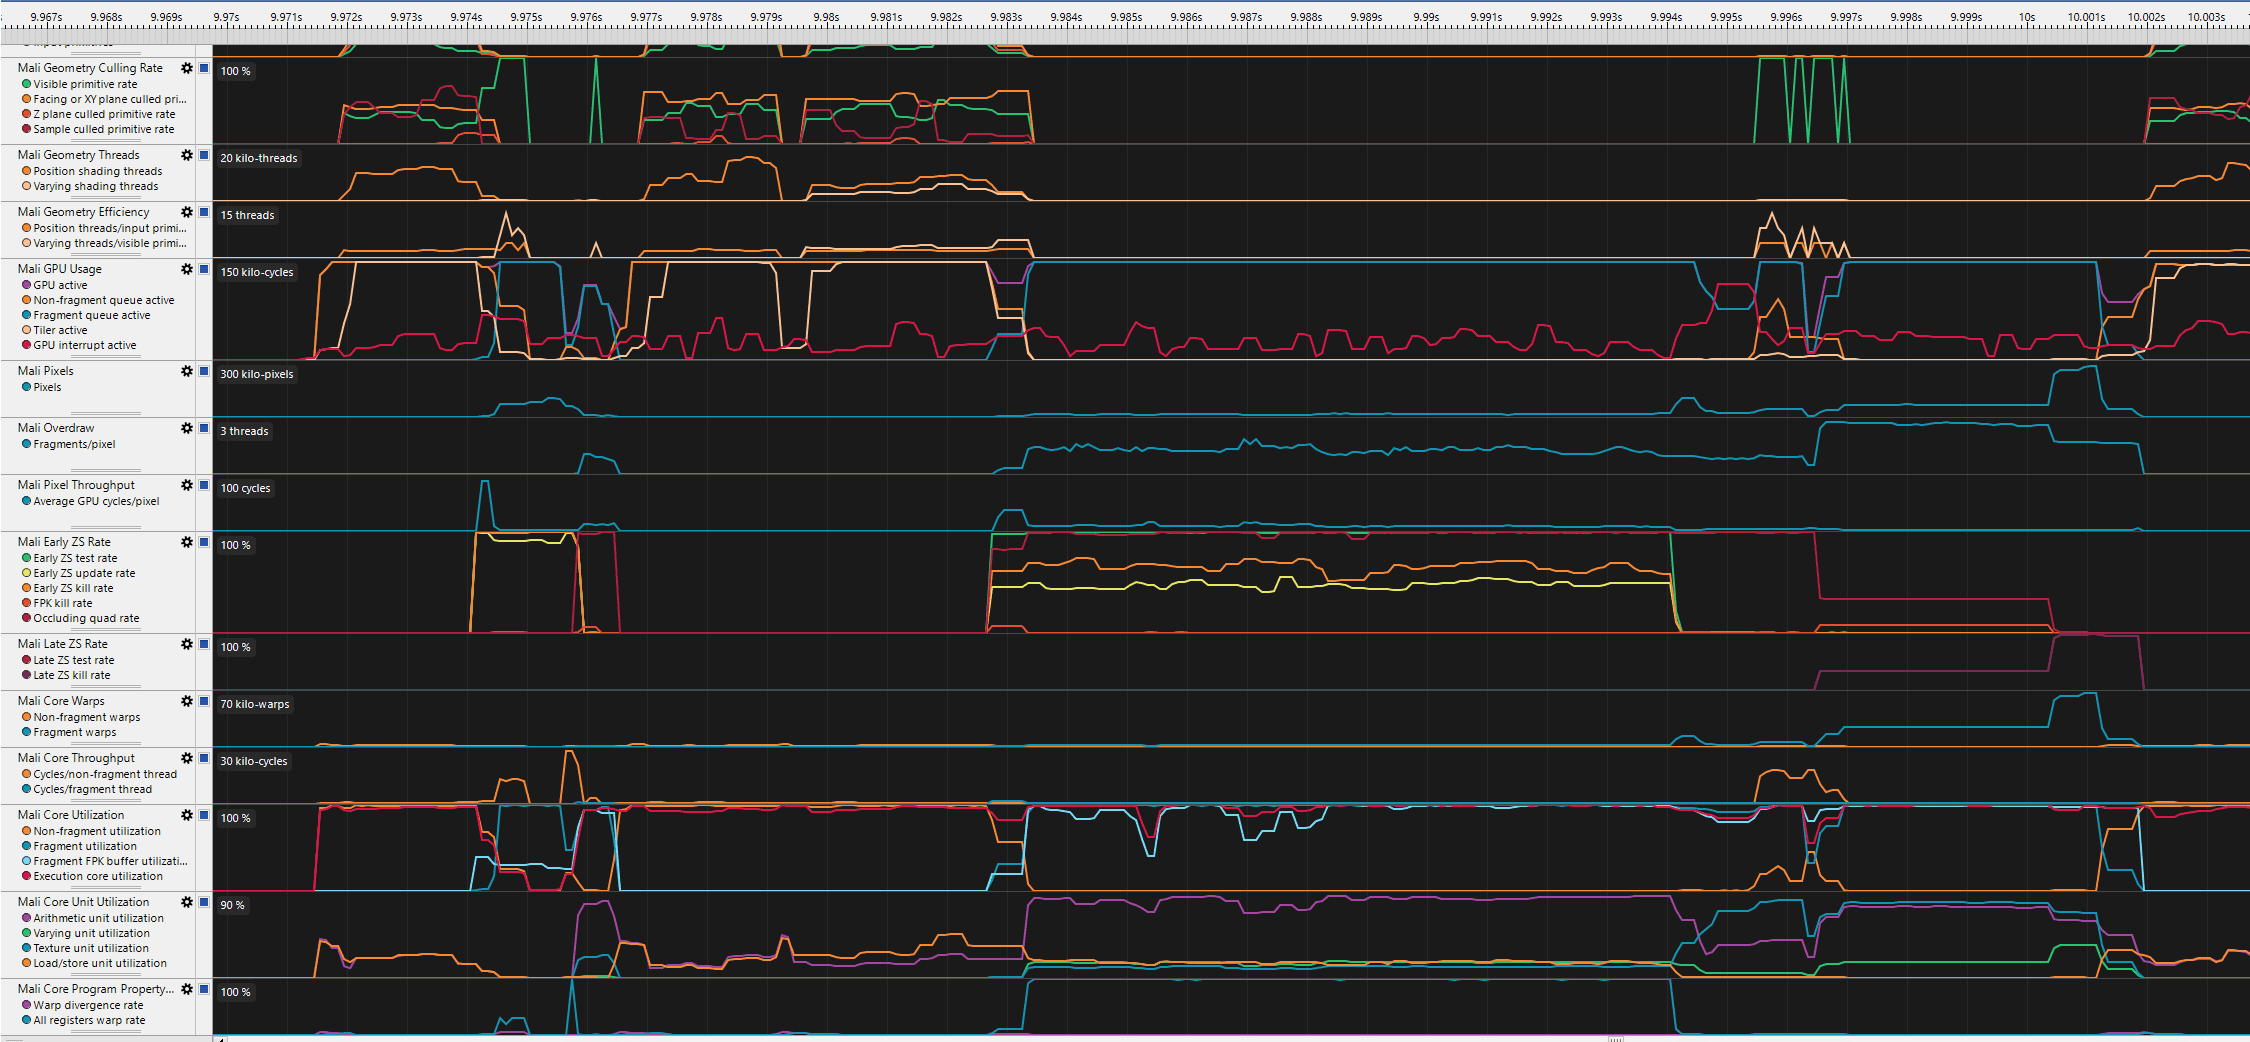
Looks like this - much easier to interpret:
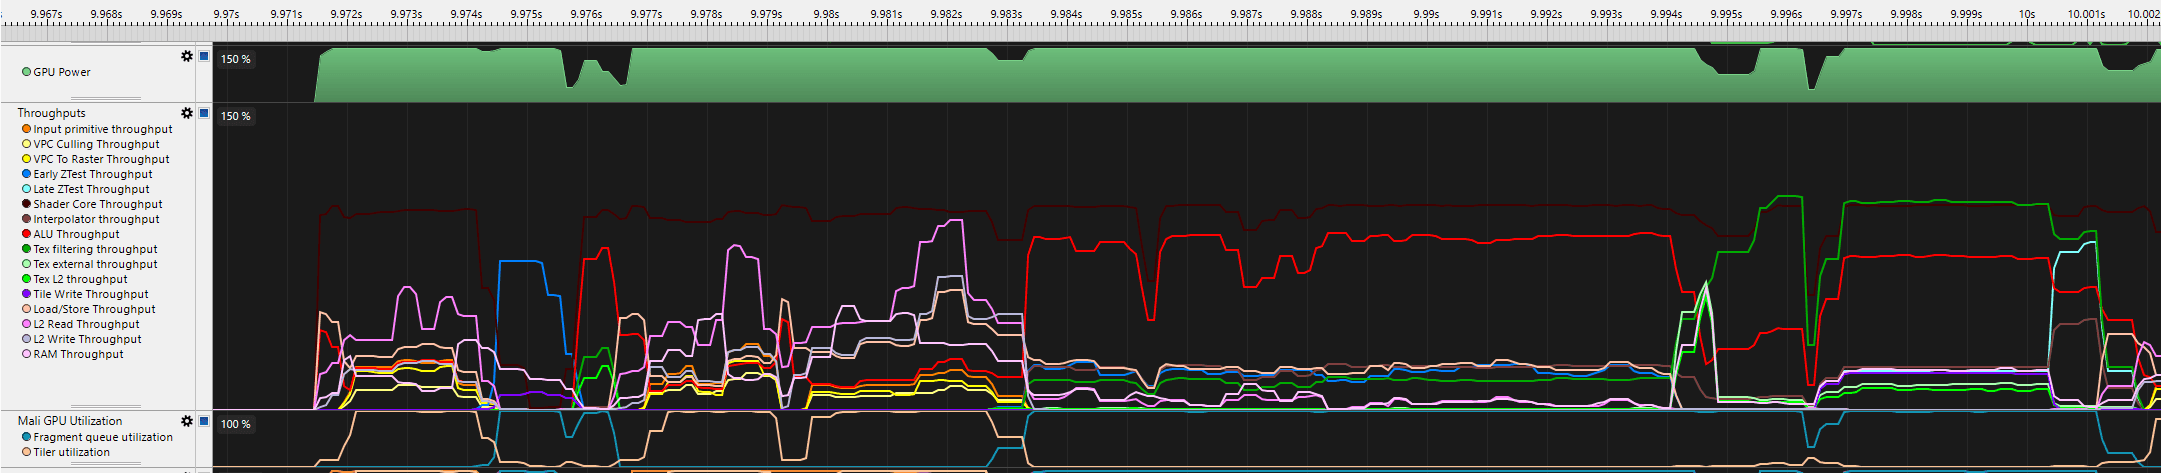
___
Figuring out the frame data
Now I can inspect GPU throughputs on my mobile. But there is one more issue to solve. There are no profiler labels.
Yes... ARM Streamline doesn't show any data about where the frame starts, where it ends, and what was rendered. I tried to figure out how to display Vulkan markers, but it looks like there is no support for that... At least for Unity projects.
Or I am doing something wrong. In this case, please contact me if you know how to get profiling markers in this tool, as I've sacrificed too many hours trying to figure this out :')
So I know the bottlenecks, but I don't know which passes, draw calls, or shaders are causing them. To figure this out, I need to know where the frame starts and where it ends.
___
Frame start and finish
Let's start by figuring out where the frame starts and where it ends.
There are two options.
I can create a debug tool to limit the target framerate to 10 FPS or 5 FPS and look for GPU idle time, as the frame will be surrounded by GPU idle time
Or I can use an educated guess and try to find repeating patterns.
Let's look at both of those options.
___
Lowering the target framerate
When I lower the target framerate to 10 FPS, so all frames render within the frame budget, the GPU will have idle time between frames.
Here, I used a 10 FPS cap to capture the frame. Notice the idle time between frames.
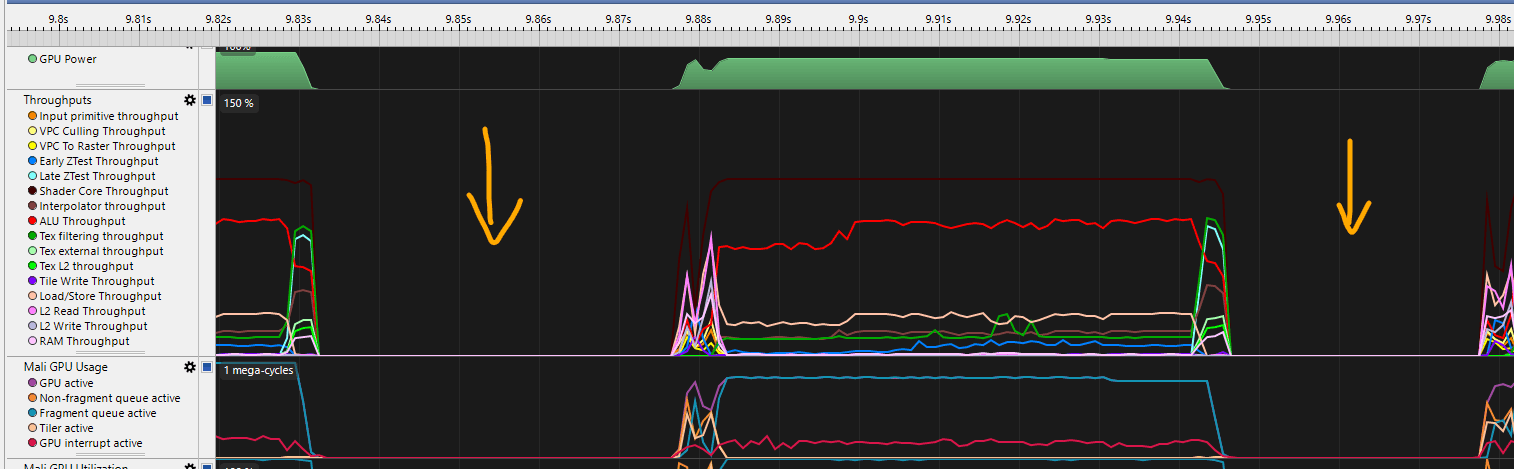
Now I know exactly where the frame starts and where it ends.
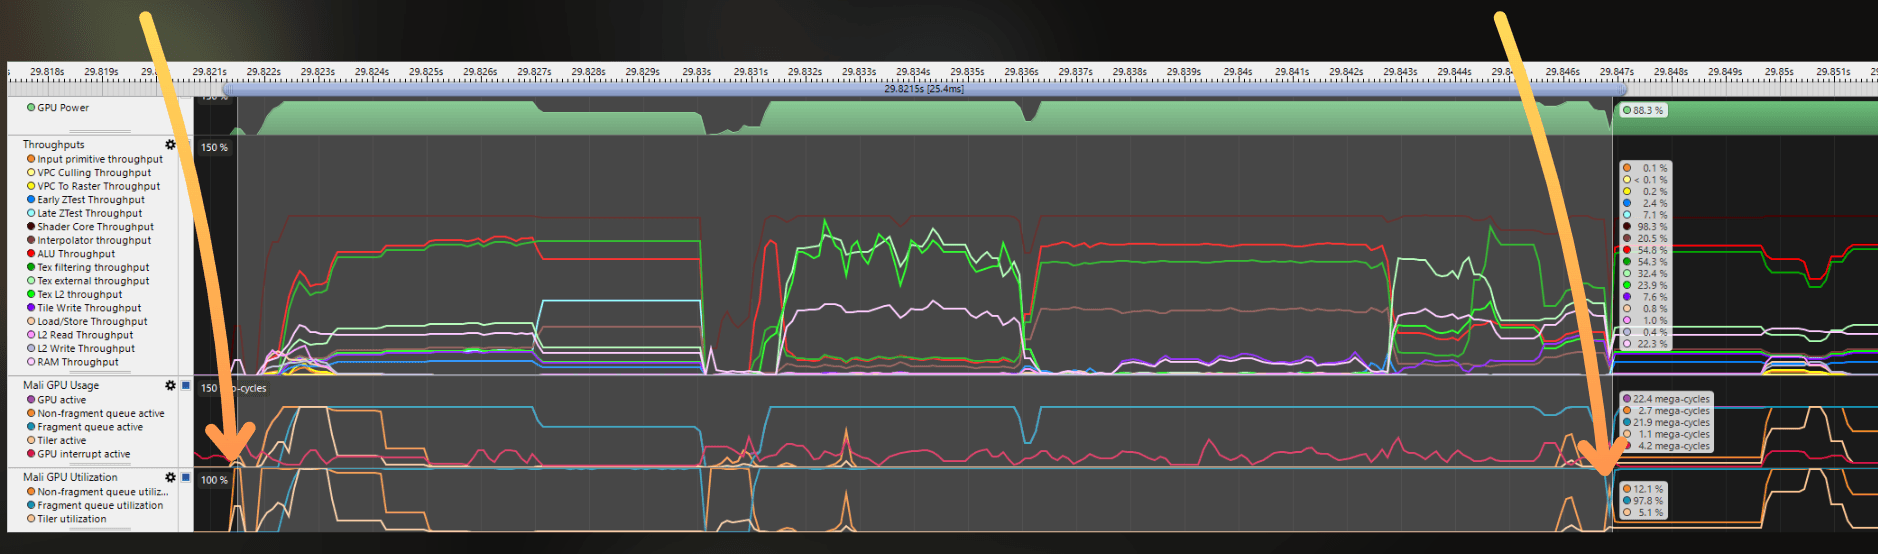
I can select the "busy" part of the frame to measure the frame time.
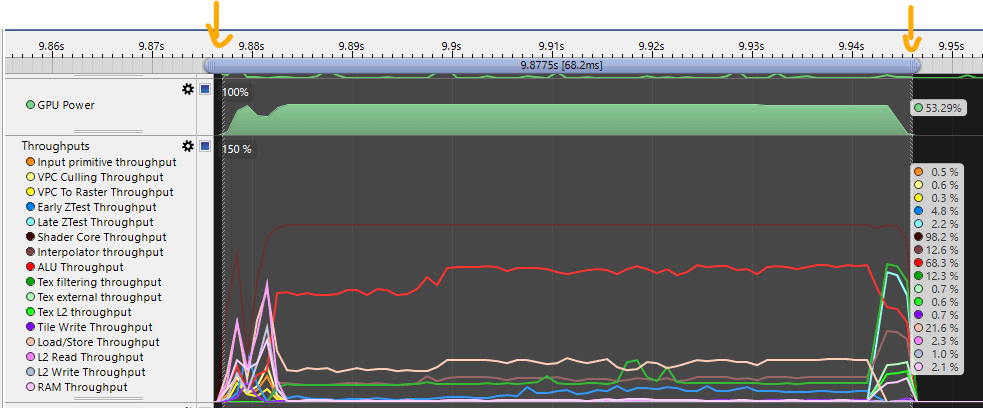
But there is one drawback to this method. Mobile GPUs throttle performance when the GPU frame time is below the target. Here you can see that the GPU clock rate is at 50% of its maximum capacity, so the frame renders much slower than it could! However, it is good enough to figure out the main bottlenecks.
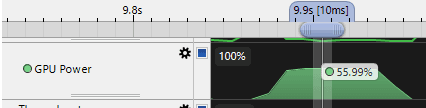
And this is one of the issues with mobile. Mobile GPUs will usually throttle the GPU to make the frame time as close as possible to the target framerate and save energy. This makes profiling really challenging, so observing the GPU clock speed is super important. When you measure the frame time, you need to always check the GPU clock speeds to scale it accordingly.
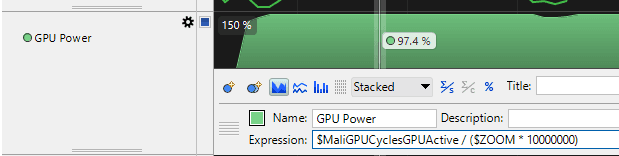
I figured out a GPU clock percentage query for my GPU:
It shows the approximate percentage of maximum GPU clock speed during the selected range. If it shows around 50%, the GPU is not running at full clock, so measured frame time may be slower than what the GPU could render at full speed.
___
Figuring out the frame pattern
If I can't figure out where the frame starts, I try to find patterns in the throughputs. In the example below, I could just select the region between repeating patterns to measure the frame time.
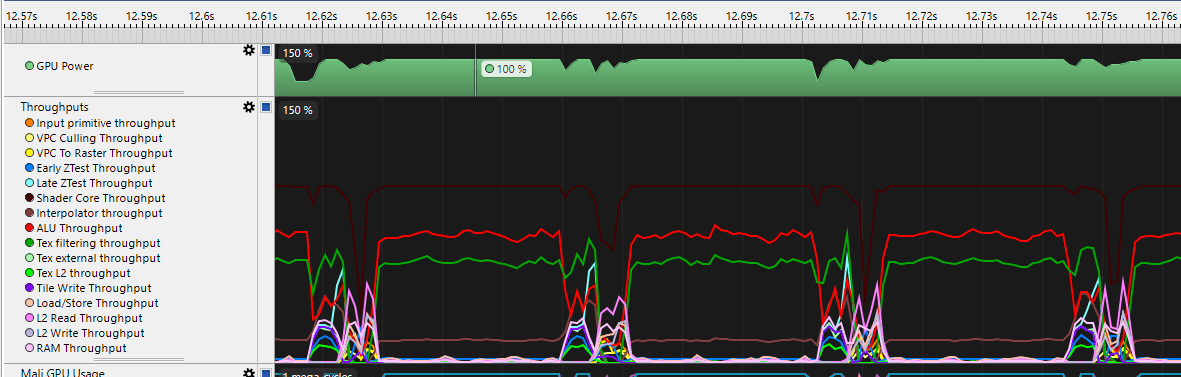
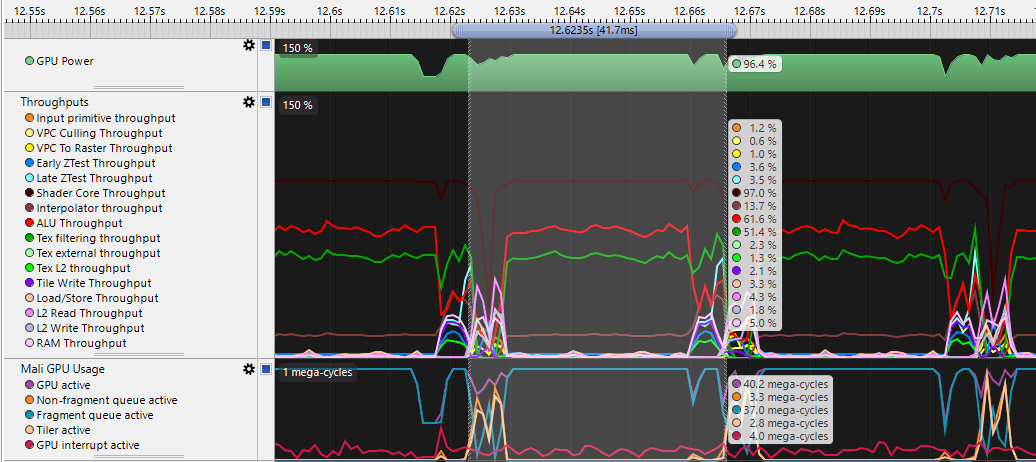
But let's go further and figure out where the frame actually starts. Usually, between frames, the GPU is idle for a very short time. The frame starts by fetching vertices into the pipeline, where vertex processing is active but fragment shading is not. So I look for:
High activity of vertex processing
No fragment shading active
Repeating pattern that ends with GPU idle or starts with GPU idle
Let's look at a simple example. One large batch of vertices where no fragment shading was active. Also, GPU utilization dropped a bit during this time.
Now let's look at more tricky scenario:

Now, repeating patterns: fetching vertices into the pipeline.
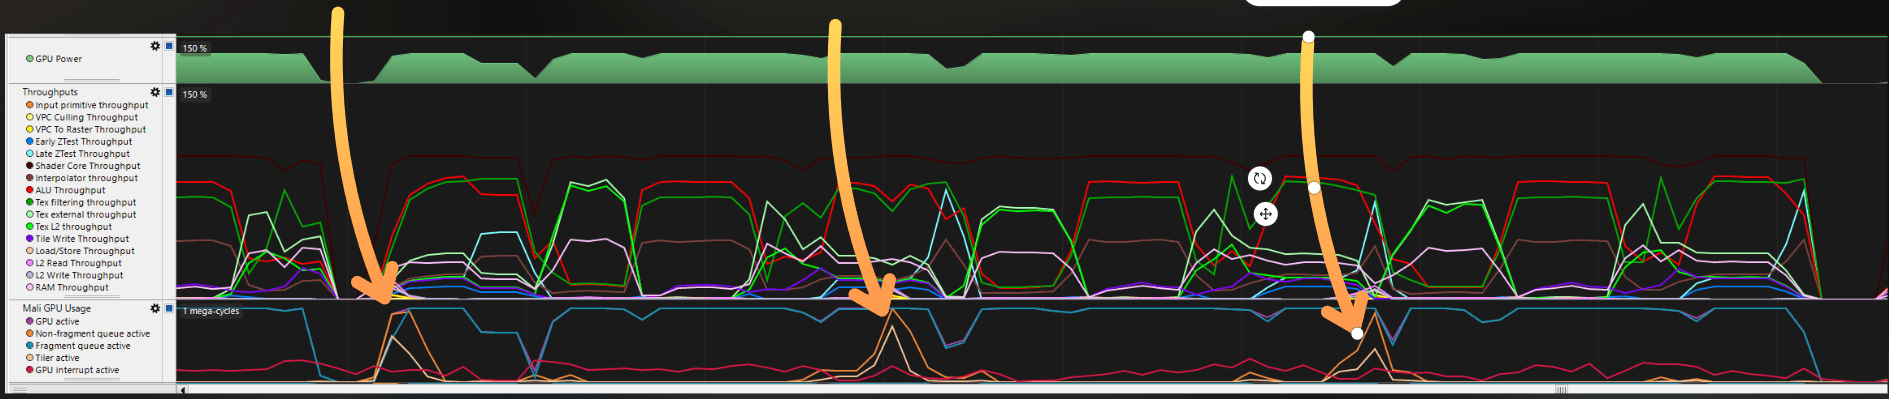
I zoomed in a bit. I started to measure the frame just after the GPU-idle region and finished measuring just after observing a similar pattern of vertex processing and a dip in fragment shading. It was also useful that I knew the frame was about 25 ms, as the game was running close to 50 FPS.
___
Frame passes
Now I know where the frame starts and where it ends. Time to figure out which parts of the chart represent different passes.
Figuring out what is rendered and when in ARM Streamline is always an estimation for me. I try to match patterns from ARM Streamline with RenderDoc markers and use that to decide where are specific passes in the captured frames.
Let's say I have this frame rendered:
The pipeline works like this:
Shadowmap rendering
LUT Generation
Depth prepass
Forward pass
Bloom
Uber postprocess
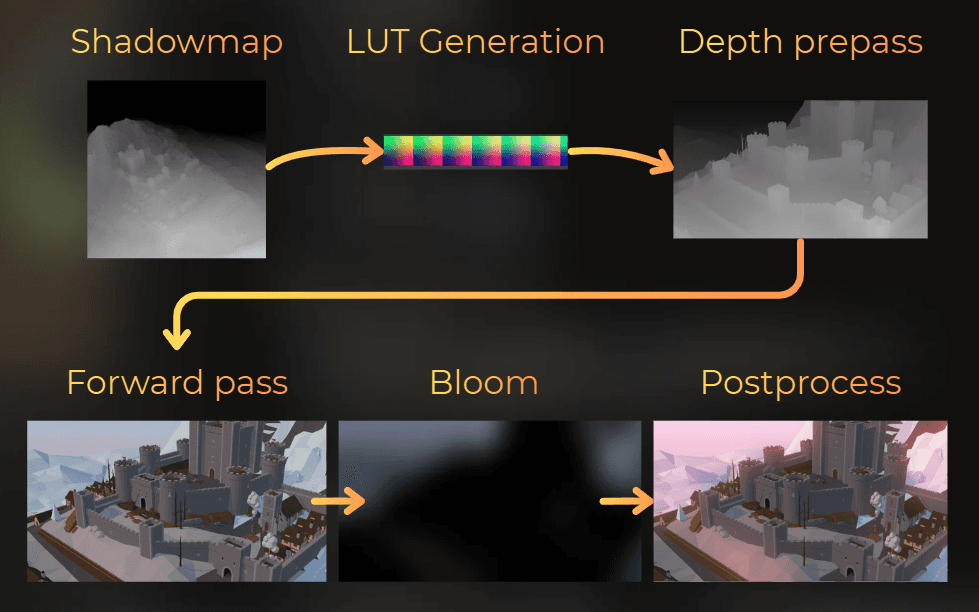
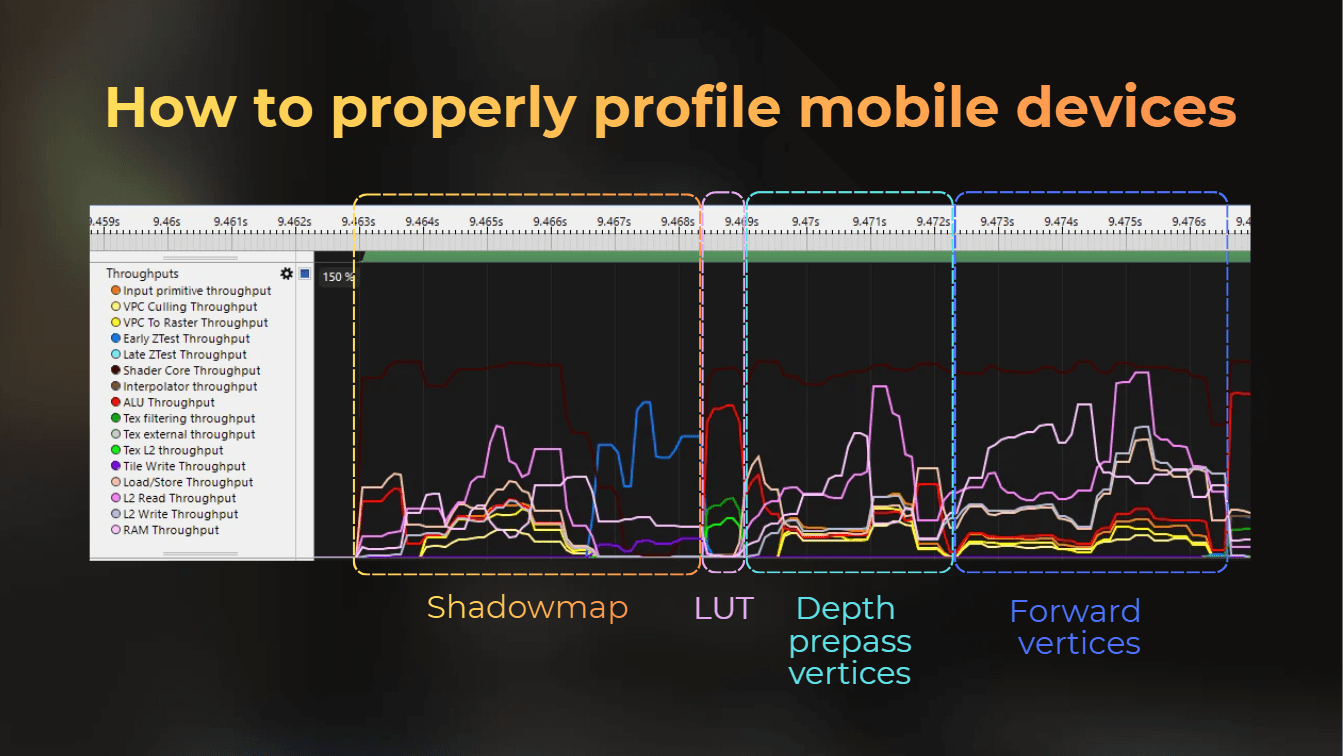
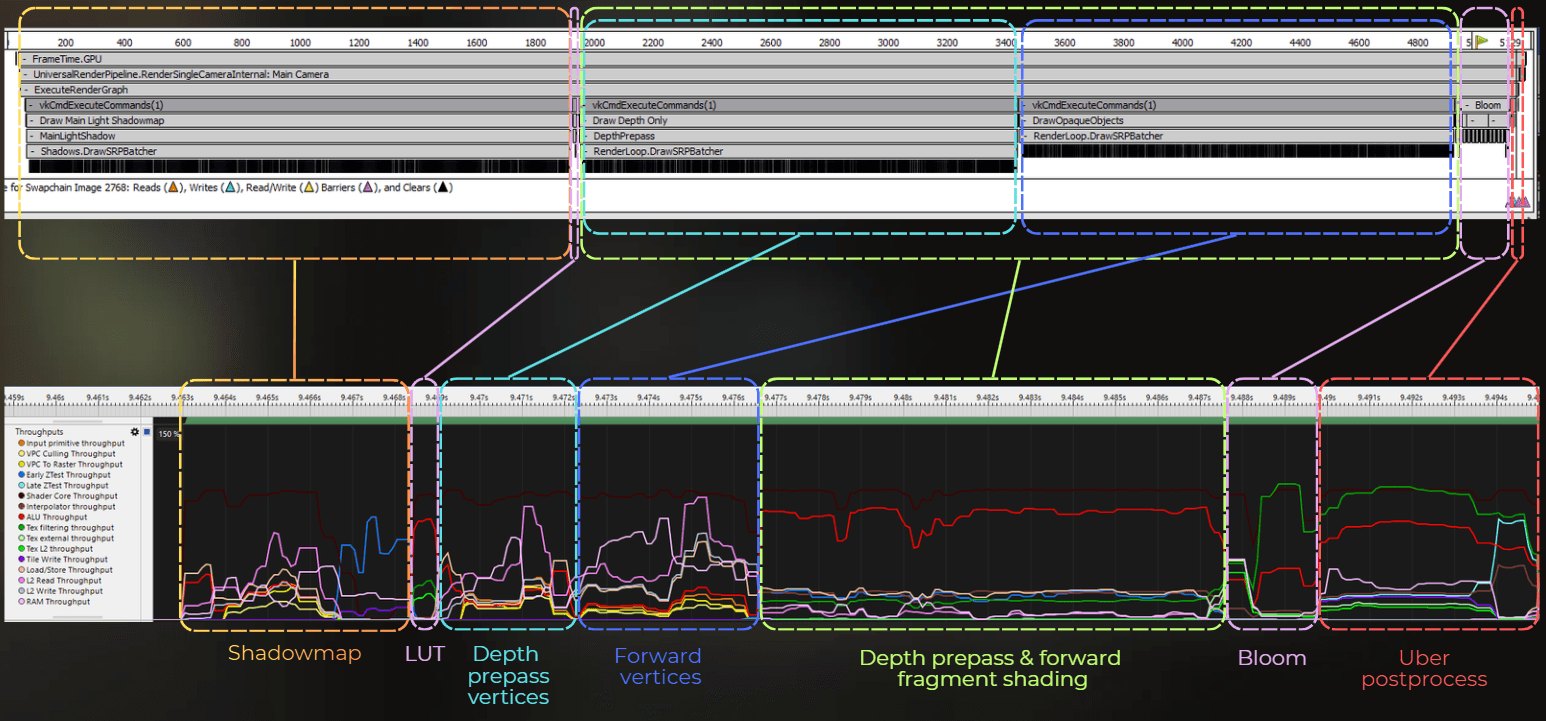
And in ARM Streamline, the frame looks like this. Notice how custom throughputs make it easier to analyze:
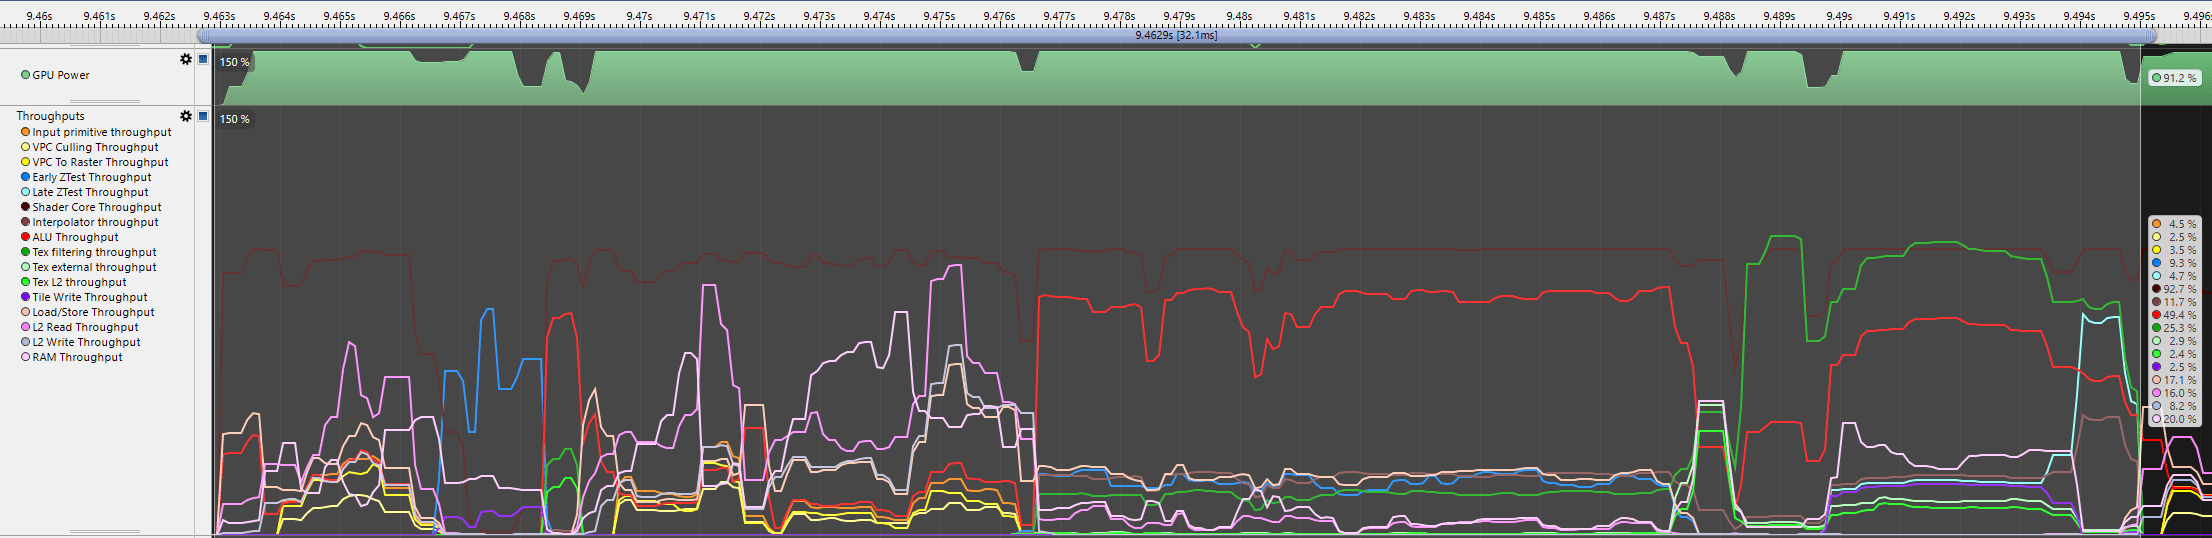
Let's try to decode it. I created a frame capture using RenderDoc, and I will try to match the markers from RenderDoc to ARM Streamline.
Notice that RenderDoc contains the timeline view above. However, there is no correlation there between the event and its size on the timeline in RenderDoc. So I need to figure out what parts of the ARM Streamline chart represent the individual passes.
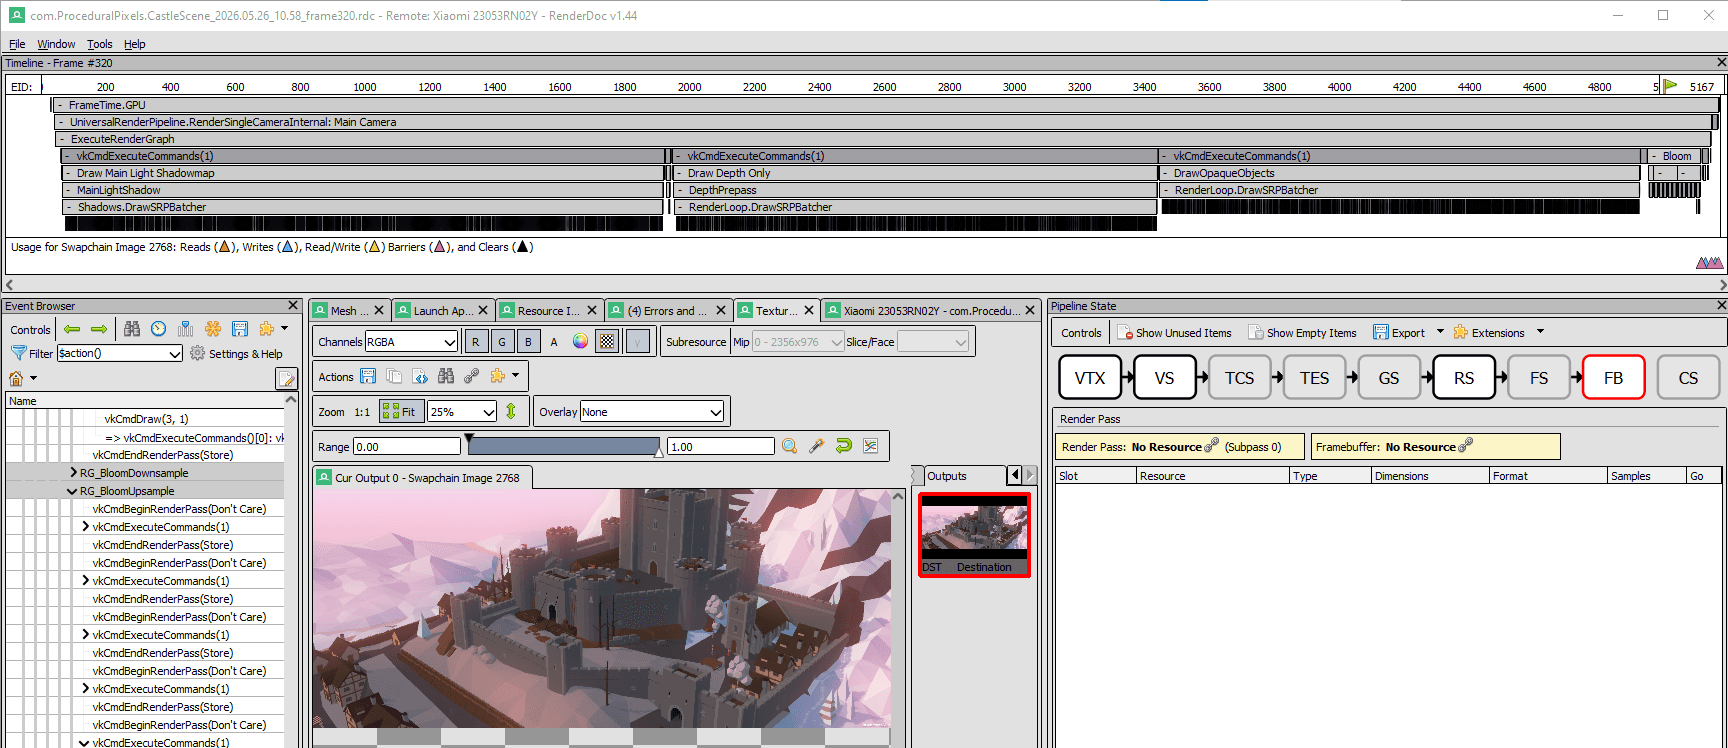
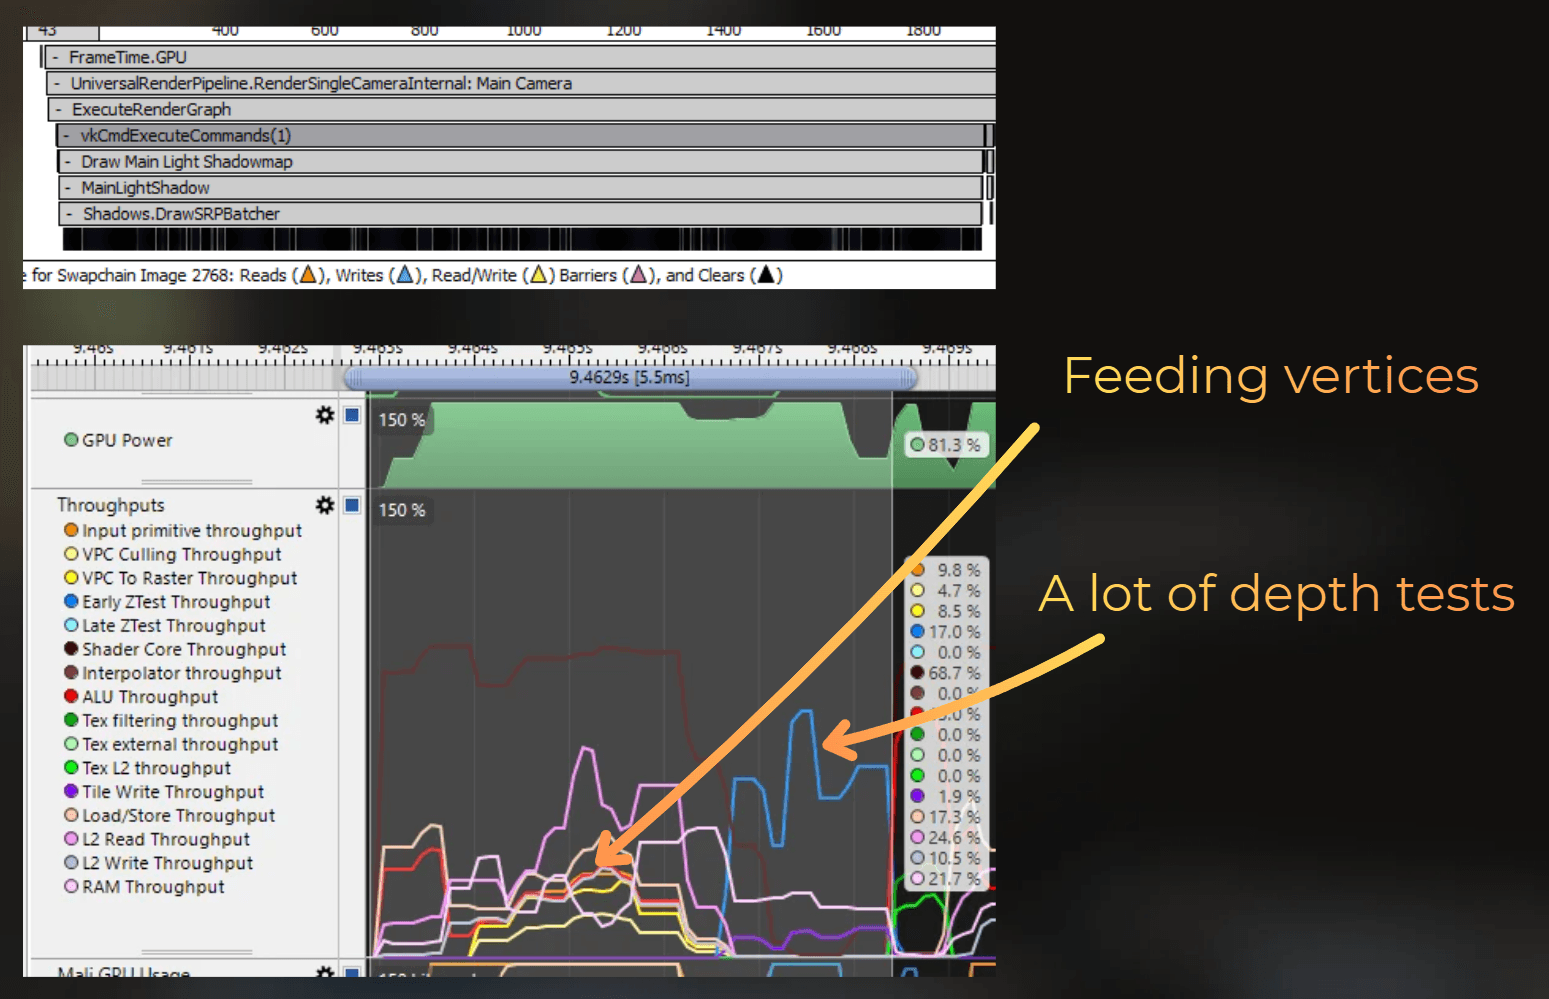
The frame starts with shadowmap rendering, so a lot of vertices will be fed into the pipeline, followed by depth testing. Shadowmap rendering took 5.5 ms. You can see below that I selected the start of the frame, till the end of the Early ZTest workload.
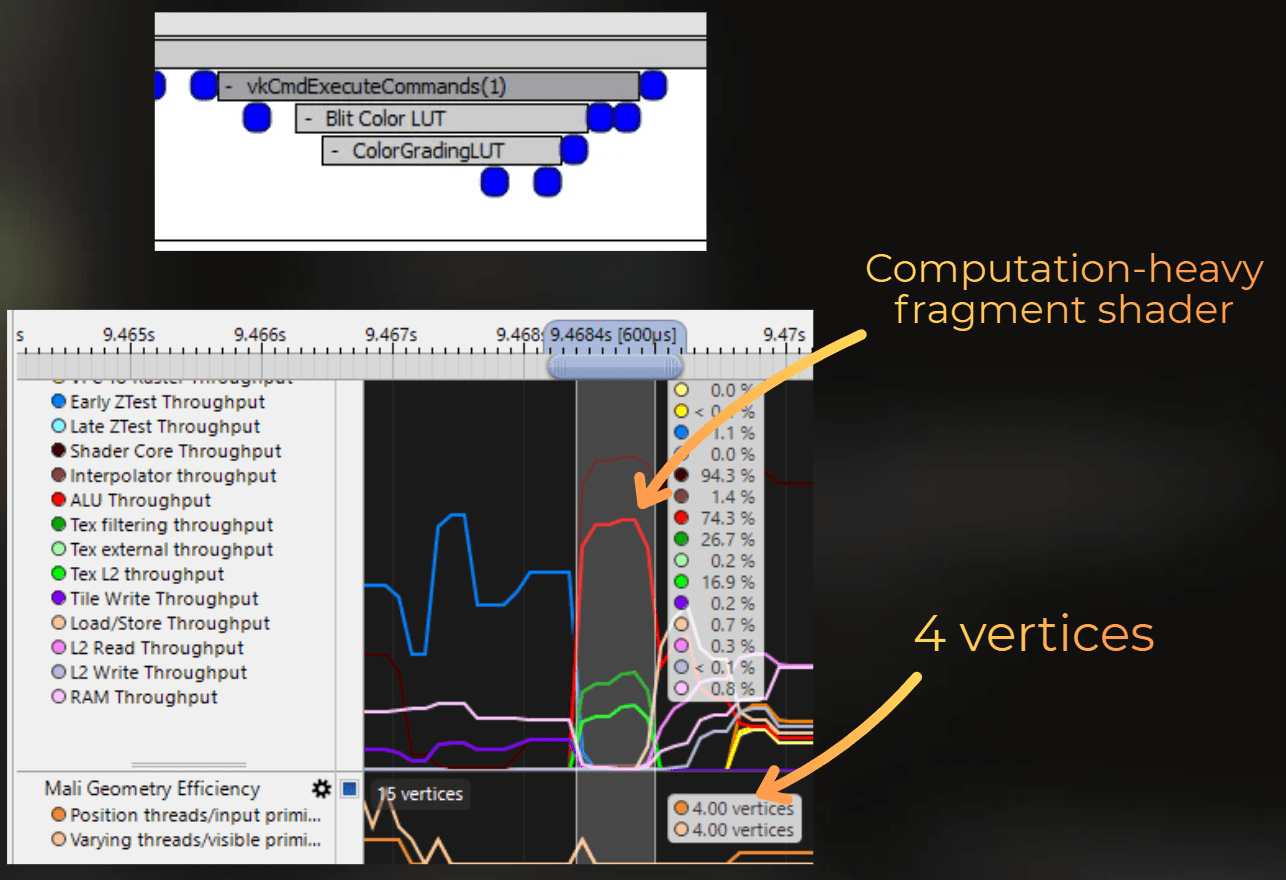
Then, 4 vertices were processed through the pipeline with a high ALU workload. This will be LUT processing, taking 0.6 ms - the part where ALU was stressed.
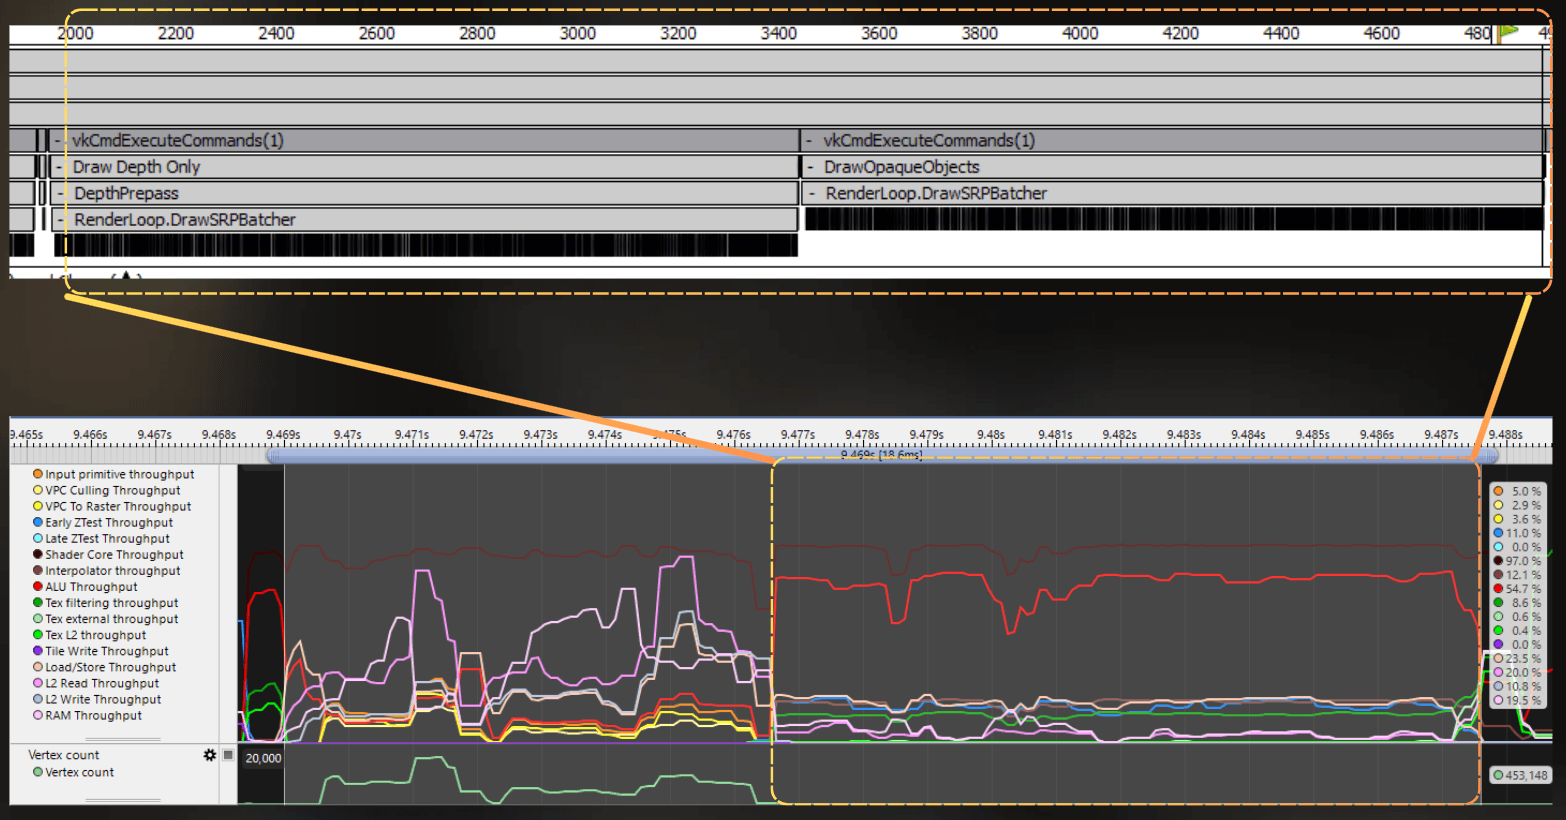
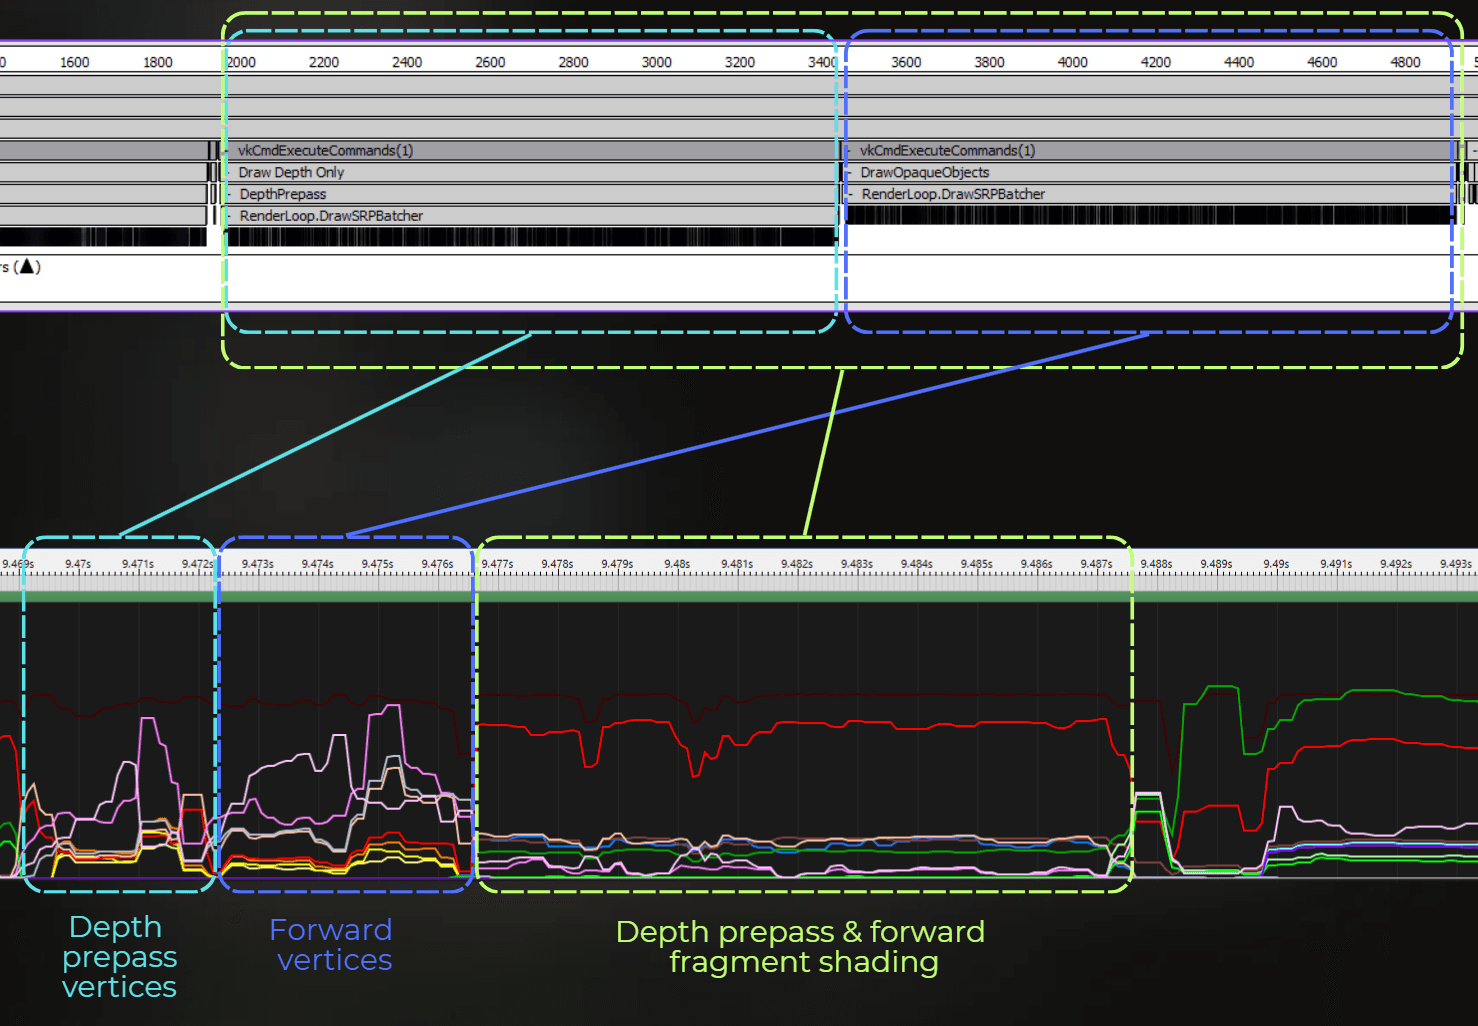
Then, a lot of vertices are processed. First, the GPU feeds vertices and executes the vertex shader for the depth prepass, and then vertices for the forward color pass. Depth prepass and forward shading take 18.6 ms.
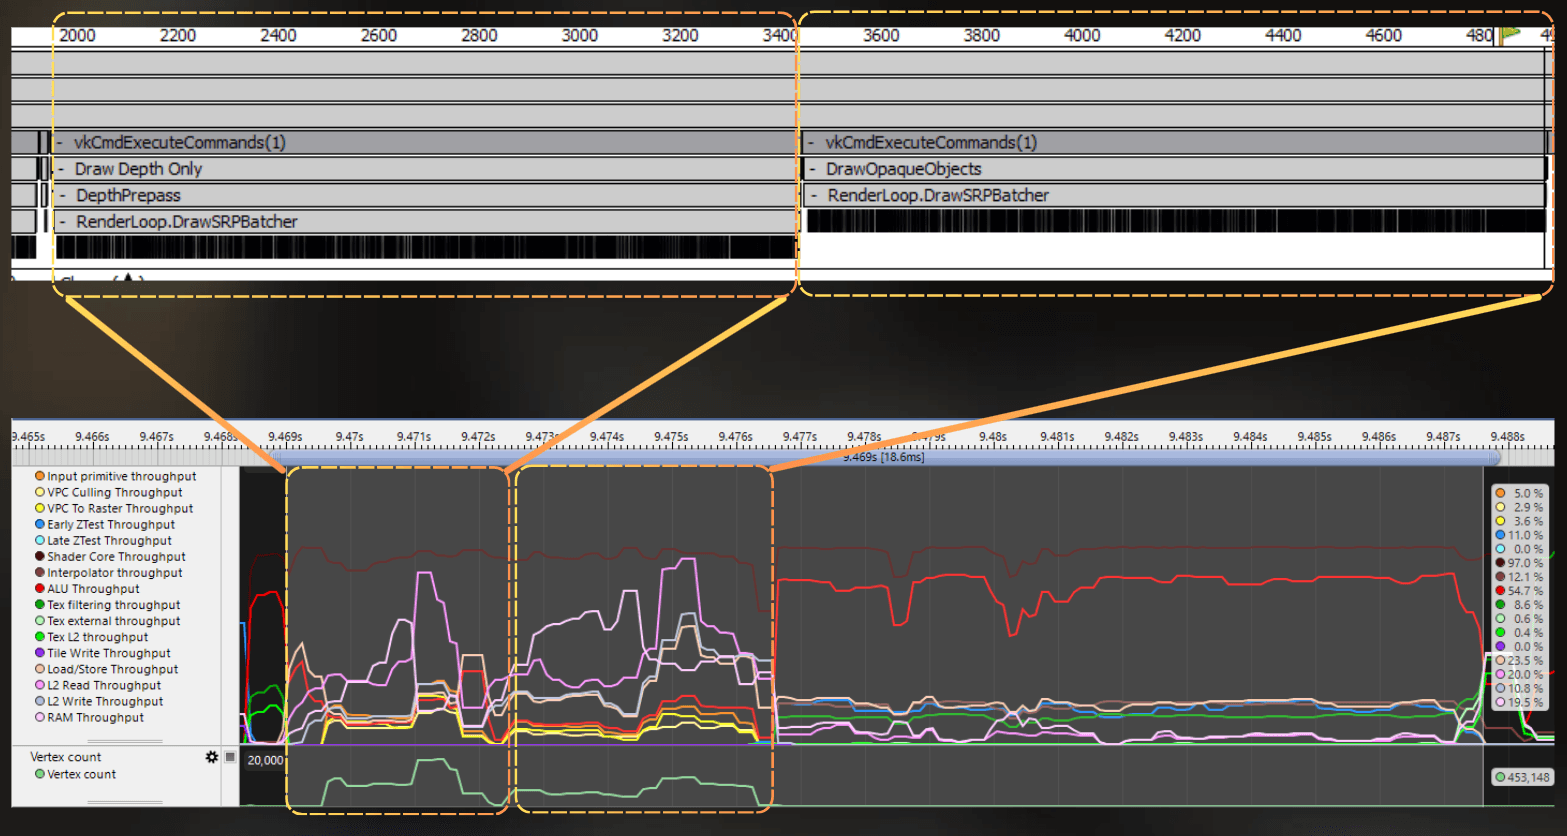
Then depth prepass and forward color rendering are merged and executed as one block in tile-based rendering. So fragment shading is combined for both passes:
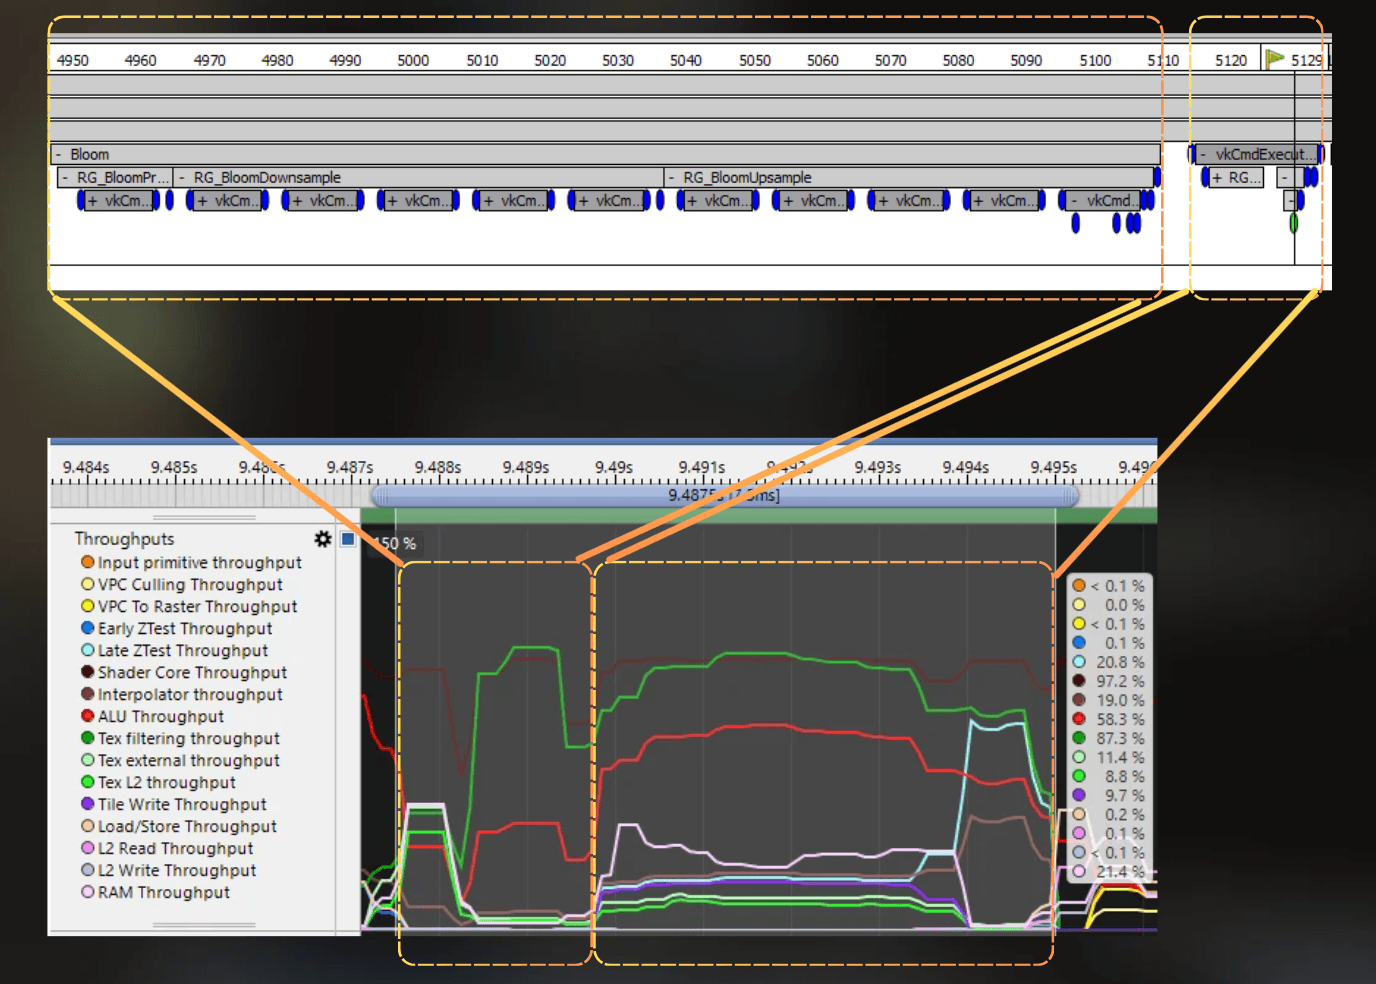
And at the end, there is a postprocess pass that contains bloom and the uber postprocess. Both take about 7.5 ms.
Tbh, I'm not sure if bloom and uber are properly separated here, as all the vertices for bloom were processed before the depth prepass and forward fragment shading. However, 4 vertices were processed exactly where I marked the start of the uber postprocess. This makes me think that the measurement should be good enough. To improve it, I could create a debug tool or a separate build with bloom disabled or uber disabled, but I was too busy to do that at this point.
___
Why not use RenderDoc for profiling?
The difference between the RenderDoc timeline and the real execution time of this frame is really high. RenderDoc shows events in the execution order according to the graphics API. However, the length of the elements in this view doesn't represent the real render time, which can be very misleading.
RenderDoc is a debugger, not a profiler.
Look at the uber postprocess. In RenderDoc, it is a single dot in the timeline, just one draw call. However, during rendering, postprocessing was taking more than 5 ms.
Also, event durations reported by RenderDoc are very different from what ARM Streamline reports, and I never saw them match properly.
Shadowmap rendering, for example: 4033 ms according to RenderDoc, while I measured 5.5 ms in ARM Streamline.
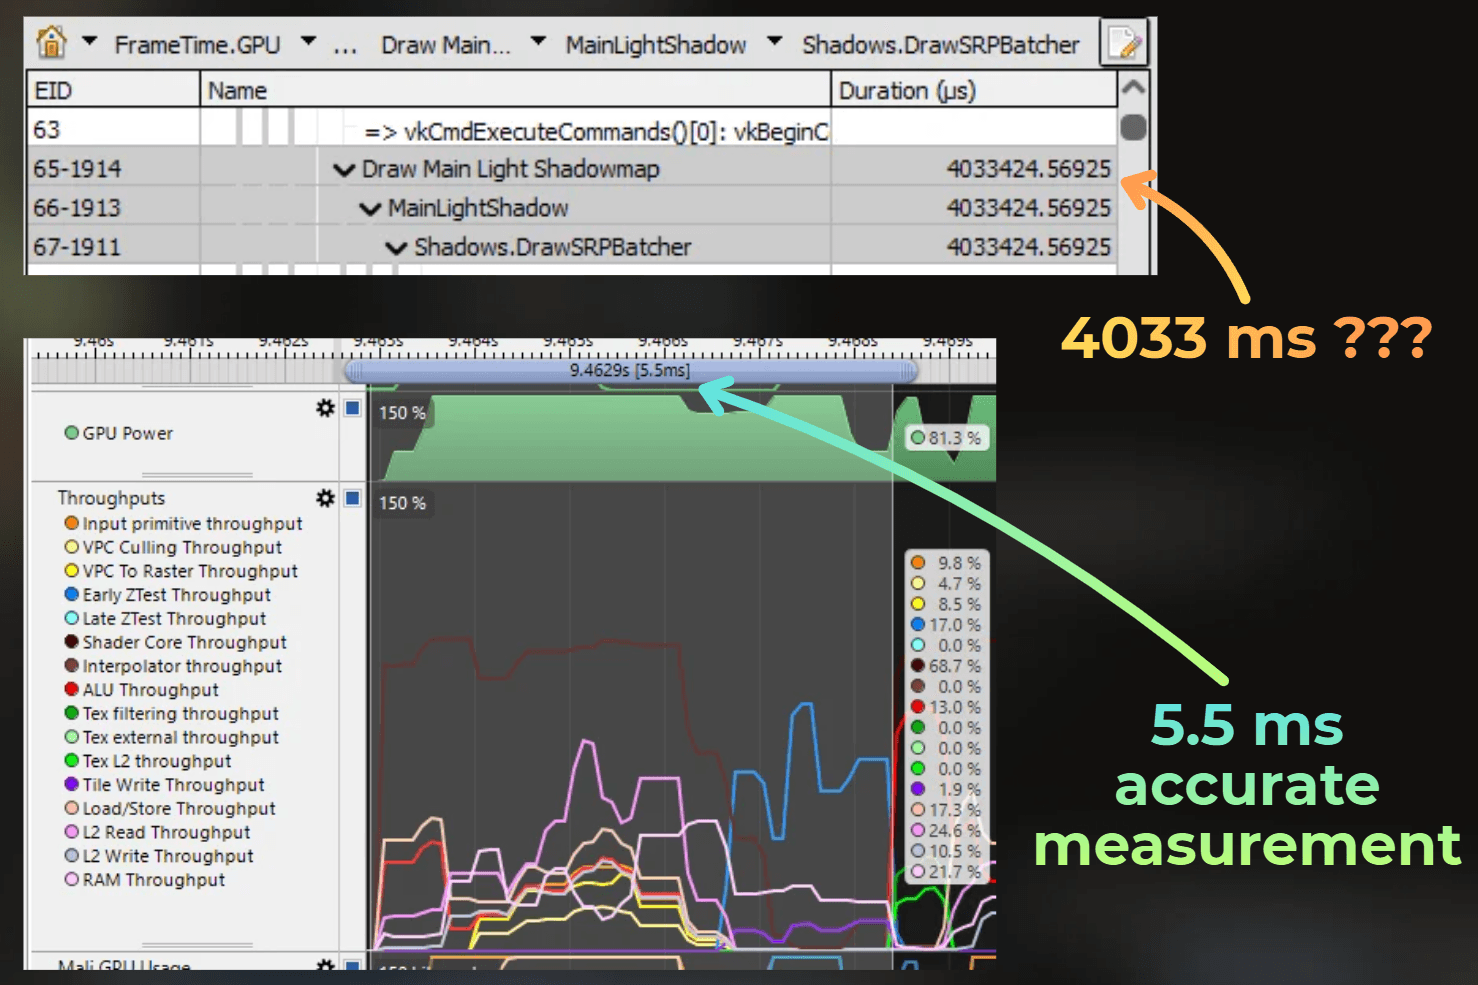
This 4033 ms value may be just a wrong unit conversion issue. Even if the units are off and it meant 4.033 ms, it is still not accurate according to what I measured on my device when the application was running. The closest measurement I got was 4.3 ms.
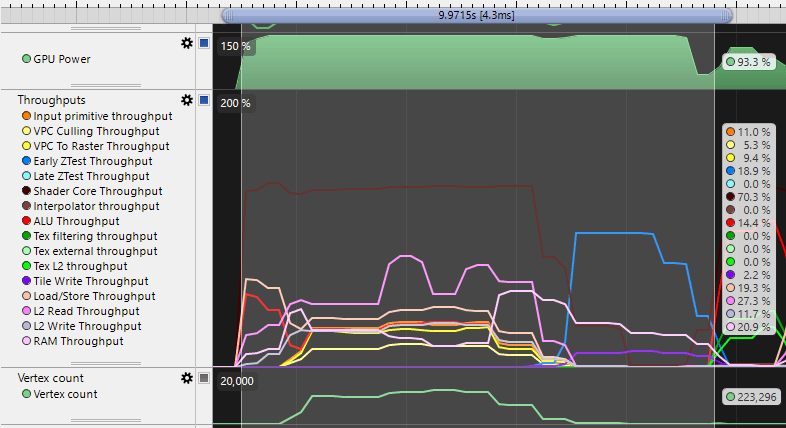
However, some events are impossible to measure independently. The GPU processed all vertices of two passes first, and then combined their fragment shading and executed that in one batch.
It is impossible to get an accurate measurement of depth prepass or forward shading separately in this scenario.
___
Planning the optimizations
Now, when I know what is rendered in each frame in ARM Streamline, I can estimate the bottleneck.
It works like this:
I look at the highest line in the throughput graph. This is usually the main bottleneck
If all throughputs are low, I need to minimize GPU state switches, improve batching, or render larger objects
Let's see how it looks for the captured frame:
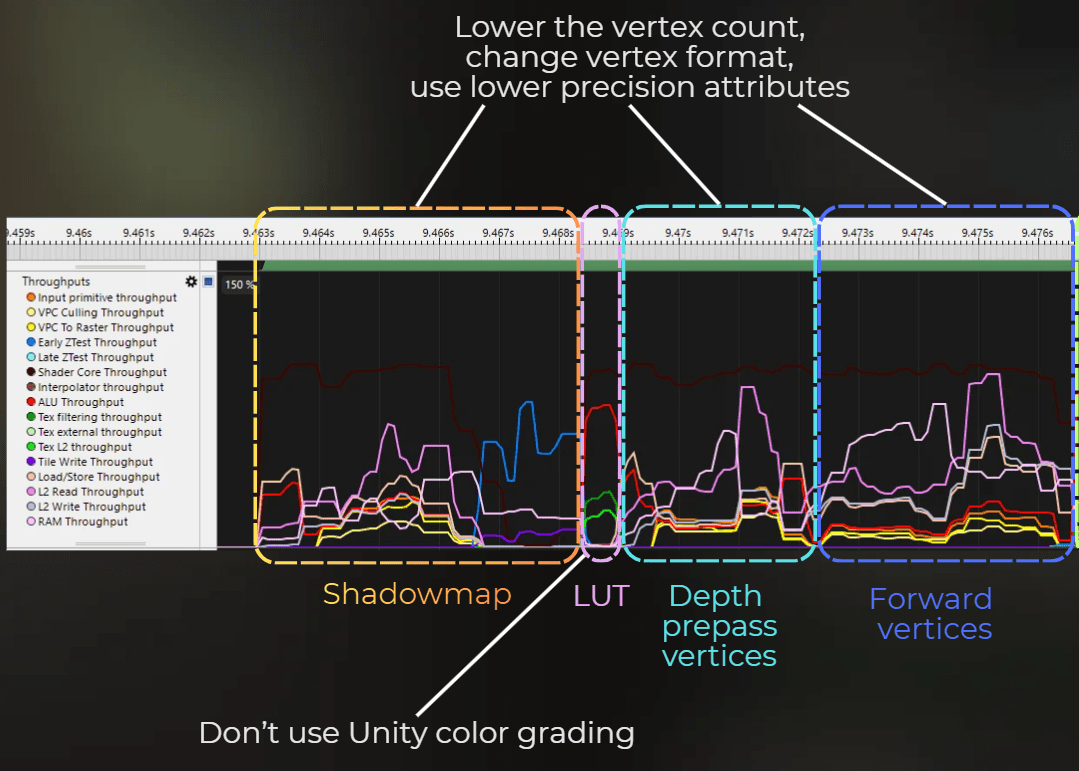
For shadowmap, depth prepass, and color pass vertex shading:
Focus on lowering the memory pressure
Remove unnecessary vertices
Change vertex format and organize streams differently
Use lower precision attributes
Disable depth prepass
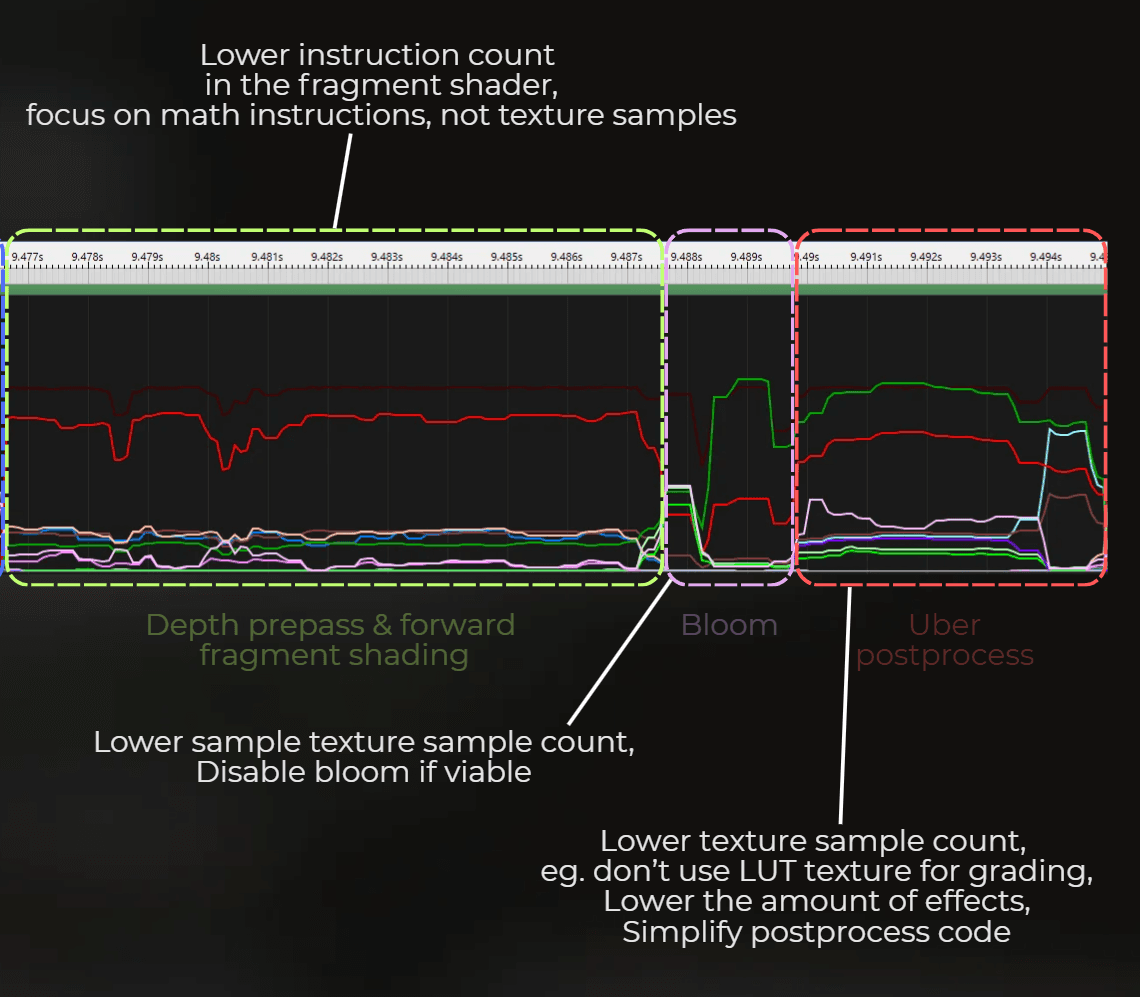
For depth prepass and forward pass fragment shading:
Focus on simplifying the math in the shaders, eg. simplify lighting, switch from PBR lighting to Blinn-Phong, etc.
Don't focus on textures
For postprocess:
Lower sample count in the bloom kernel
Disable bloom if possible
Lower texture sample count in the postprocess, eg. by not using a LUT texture for color grading and using just a math formula for grading
Minimize the number of effects in the postprocess
Remove the postprocess completely and implement it at the end of each fragment shader
___
Summary
ARM Streamline is not a perfect mobile GPU profiler. It doesn't show profiler labels, it doesn't give me a nice frame capture, and the raw counters are hard to understand.
But after calibrating custom throughput queries, it becomes useful. I can see which part of the Mali GPU is close to saturation, and this is usually enough to decide what kind of optimization makes sense.
Here is the workflow I use:
Create small benchmarks that stress one GPU unit at a time.
Convert raw counters into calibrated throughput percentages for one specific device.
Watch GPU clock speed, because mobile GPUs throttle aggressively.
Use repeating patterns and RenderDoc captures to estimate where frame passes happen.
Treat pass timings as estimates, not exact measurements.
Debug tools to temporarly disable some render passes, swap shaders, change some render parameters are super useful to figure out what is happening in each frame.
The most important thing is that ARM Streamline and RenderDoc answer different questions. RenderDoc helps me understand what was submitted to the graphics API. ARM Streamline helps me understand what the GPU was actually doing over time.
For mobile profiling, this is good enough to stop guessing.